
Memory Consumption
Today we're going to look at how MATLAB Graphics uses memory.
First we need a way to tell how much memory MATLAB is using. Because I'm using a Windows system, I can use the memory function. This isn't the most accurate way to measure memory consumption, but it is easy to use, and it is accurate enough when we're working with large arrays.
rng default
minit = memory;
mega = 1024^2;
sprintf('%g MB',minit.MemUsedMATLAB/mega)
ans =

1218.53 MB
Now we need a large array. I'm going to create an array with 150 million values, and I'll use the uint8 data type to keep things relatively compact. I'm using some fairly random looking data to make sure that we don't get confused by some optimizations which can kick in for certain types of simple curves.
npts = 150000000;
events = sort(randi(npts,[500 2]),2);
[~,ix] = sort(abs(events(:,2)-events(:,1)),'descend');
events = events(ix,:);
d = zeros([1 npts],'uint8');
for i=1:size(events,1)
    d(events(i,1):events(i,2)) = randi(255,1);
end
We can see that this array consumes 150 million bytes, and MATLAB's memory grew by a little more than that.
whos d
marray = memory;
sprintf('%g MB',(marray.MemUsedMATLAB - minit.MemUsedMATLAB)/mega)
  Name      Size                       Bytes  Class    Attributes

  d         1x150000000            150000000  uint8


ans =

152.117 MB
Now we'll create a plot from this array. First we'll create a figure and axes.
axes
drawnow
maxes = memory;
sprintf('%g MB',(maxes.MemUsedMATLAB - marray.MemUsedMATLAB)/mega)
ans =

26.4648 MB
That used a little more than 25 megabytes. That's because this is the first time we've used MATLAB Graphics in this session of MATLAB. Because of that, it had to load the graphics libraries, and get OpenGL started. Subsequent plots won't take this hit.
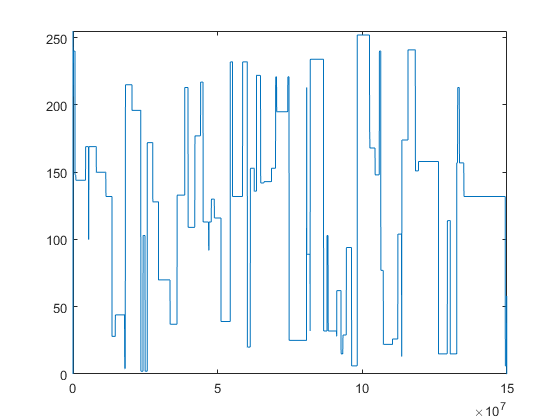
Now we'll call plot.
plot(d)
ylim([0 255])
drawnow

If we check on memory consumption, we'll see that MATLAB is now using another 20 megabytes or so.
mplot = memory;
sprintf('%g MB',(mplot.MemUsedMATLAB - maxes.MemUsedMATLAB)/mega)
ans =

23.4492 MB
What do you think will happen if we change one of the values in that array? Let's try it and find out.
d(1000) = 255 - d(1000);
mcow = memory;
sprintf('%g MB',(mcow.MemUsedMATLAB - mplot.MemUsedMATLAB)/mega)
ans =

143.109 MB
The amount of memory we're using went way up. That's because MATLAB arrays use something called "copy on write". When we first created the plot, the YData property of the line object was using exactly the same memory as the variable d. But when I modified d, the two arrays became "unshared". This means that d and the YData are each using 150 million bytes instead of sharing the same 150 million bytes.
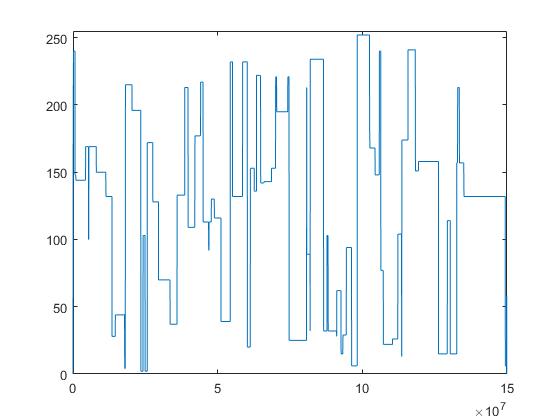
But if we set the YData array to be equal to d ...
h = findobj(gca,'Type','line');
h.YData = d;
drawnow
mredraw = memory;
sprintf('%g MB',(mredraw.MemUsedMATLAB - mcow.MemUsedMATLAB)/mega)
ans =

-141.316 MB
... then we get that memory back.
In many cases, a better way to do this is to get rid of the variable in the workspace and modify the YData property of the line directly.
clear d
h.YData(1000) = 255 - h.YData(1000);
drawnow
mydata = memory;
sprintf('%g MB',(mydata.MemUsedMATLAB - mredraw.MemUsedMATLAB)/mega)
ans =

2.75781 MB
Keeping track of whether your arrays are sharing memory or not is often key to getting the best memory performance out of MATLAB graphics.
Here's another thing to look out for. In our example, we only supplied YData. In this case, the XData starts at 1 and increments by 1 for each data point. Because this is a very common case, the line object doesn't actually allocate any memory for the XData. But if we ask for the value of the XData property, it does allocate it. This means that something as simple as the following can be quite expensive.
disp(size(h.XData))
xdata = memory;
sprintf('%g MB',(xdata.MemUsedMATLAB - mydata.MemUsedMATLAB)/mega)
           1   150000000


ans =

1145.31 MB
What happened there is that it needed an array to pass to the size function, so it created one. And since the default datatype is double, it created a really big one! It's eight times the size of the array we originally passed in. That's pretty wasteful for an array which looks like this:
1 2 3 4 5 6 7 8 9 ...
So far we've been talking about the memory that is used by MATLAB's arrays. But there's actually a different type of memory that was getting used when we create the plot. MATLAB loads a copy of the geometry into the memory of the graphics card. It's important that the graphics card has a copy that is local, and is organized just right, so that it can redraw it as quickly as possible. A lot of the 20 megabytes that were used by the plot command were this type of memory.
But notice that this is quite a bit smaller than the original array. MATLAB Graphics generates a low-res version of the shape and sends that to the graphics card. But that low-res version has to contain enough data to capture all of those details in the shape. Getting this right is pretty tricky.
We call this step "level-of-detail" or "LOD". Level-of-detail algorithms are an important field of computer graphics. Unfortunately there isn't one simple algorithm which works for all types of geometry and in all types of situations. MATLAB Graphics currently has LOD algorithms for plot, line and image. We're working on improving those, and on adding more. But if you're working with one of the other types of graphics objects, then you won't be getting this LOD reduction, and MATLAB will be sending all of the geometry to the graphics card.
There actually is one other LOD algorithm in MATLAB. It's for the Patch object, and it is called reducepatch. At this point, we don't think that reducepatch is fast enough or reliable enough to build into the patch command so that it runs automatically. But you might want to use it when you are working with a really complex patch object.
If the data you're plotting is small, then we skip the LOD step and simply put all of the geometry into the memory of the graphics card.
Now lets save the plot to a FIG file.
fig = gcf;
fname = 'c:\temp\default.fig';
tic
savefig(fig,fname)
toc
Elapsed time is 102.143896 seconds.

That took more than a minute and a half, and if we look at the file, we'll see that it's more than 380 megabytes.
s = dir(fname);
sprintf('%g MB',s.bytes/mega)
ans =

386.894 MB
That's pretty big! There are a couple of reasons for this, but the biggest one is that it actually saved two copies. The reason for this is that in R2014b, the internals of MATLAB Graphics changed enormously. So if we want to create a FIG file which can be read by any version of MATLAB, we need to save a copy in the old format as well as a copy in the new format.
We can tell savefig not to do this by adding the compact flag.
If we do this, the save only takes about 1/2 as long.
tic
fname = 'c:\temp\compact.fig';
savefig(fig,fname,'compact')
toc
Elapsed time is 55.061655 seconds.
And we can see that the resulting FIG file is less than 1/2 as large.
s = dir(fname);
sprintf('%g MB',s.bytes/mega)
ans =

185.968 MB
That can be useful if you don't have any copies of MATLAB which are older than R2014b. The compact option is fine for saving and loading FIG files in newer versions, and it's much less expensive.
If you are using a version of MATLAB which is older than R2014b, you should know that there are a number of important differences in how MATLAB Graphics managed memory in older versions.
- In older versions, MATLAB Graphics was loaded at MATLAB startup. This means that there isn't extra memory consumed on the first plot, but it means that MATLAB is using that memory even if you never do any graphics.
- In older versions, MATLAB Graphics didn't support datatypes such as uint8 very well. As a result, it often copied the data into a double array, which consumed a LARGE amount of memory. This also meant that the "copy on write" memory sharing I described didn't occur.
- In older versions, MATLAB Graphics was less aggressive about moving geometry into the memory of the graphics card. That was sometimes good in cases like this, where we're only drawing the data once. But it was a bottleneck in cases where we are repeatedly drawing the same data.
- The compact option on savefig was introduced in R2014b because earlier versions only saved the one copy.
It's also important to know that the level-of-detail algorithms in MATLAB Graphics are continuing to evolve and get better. So the amount of memory consumed in that step should continue to get smaller in future releases.
I hope that this has given you some insight into how MATLAB Graphics uses memory. Hopefully it will give you some ideas about how to free up more memory for your computations.
- Category:
- Performance

