Analyzing CheerLights with MATLAB
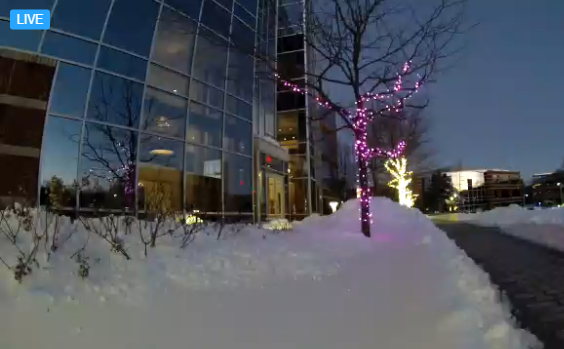
CheerLights is an Internet of Things project created by Hans Scharler that allows people’s lights all across the world to synchronize to one color set by Twitter. This is a way to connect physical things with social networking experiences and spread cheer at the same time. When one light turns red, they all turn red.
CheerLights uses ThingSpeak to collect the latest color. We get the color value by following “CheerLights” on Twitter using the TweetControl app. When someone Tweets using “CheerLights” and a color name, the TweetControl app writes the color to the CheerLights Channel on ThingSpeak. Other developers wanting to join the CheerLights project read in the latest color value using the ThingSpeak Channel API and then set their light color to the same one.
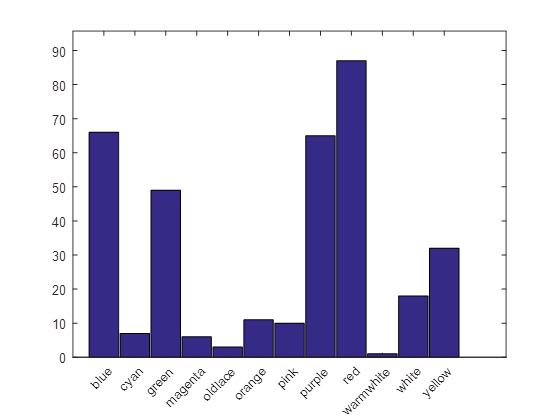
With some MATLAB Analysis and Visualizations, I know that currently red is the most popular color on CheerLights! I have recently taken advantage of the MATLAB integration with ThingSpeak. Under Apps -> MATLAB Analysis, we have an example that will show you how to analyze the public CheerLights Channel on ThingSpeak to determine the most requested color. The MATLAB Analysis example is called, “Analyze text for the most common color”.
Example MATLAB Visualization Code
lights = thingSpeakRead(1417,'OutputFormat','table','NumDays',30);
hist(categorical(lights.LastCheerLightsCommand))
set(gca,'XTickLabelRotation',45)
People all over the world have joined CheerLights by making all kinds of light displays, apps, and browser plugins. I recently created a CheerLights display for my parents using a LIFX Wi-Fi Light Bulb. If you want to control all of the lights, just send a Tweet using Twitter that mentions @CheerLights and a color.
“@CheerLights Let’s go Blue!”
Check out CheerLights.com for more detail and for ideas on how to join the project. We are all connected!


コメント
コメントを残すには、ここ をクリックして MathWorks アカウントにサインインするか新しい MathWorks アカウントを作成します。