
You’ve Collected Lots of IoT Data, Now We Can Help You Figure Out What It Means!
For the last several years, I have been collecting data with ThingSpeak from devices all around my house. I have been tracking temperature, humidity, light levels, outside weather data, my deep freezer’s temperature, the state of My Toaster, and air quality metrics. I just recently started to think about what all of this data really means to me and if it’s good data to begin with. Wouldn’t it be great if I could explore my data in ThingSpeak? Well, I am happy to say that with the latest upgrade to ThingSpeak, you can do just that.
We have been working with the MATLAB team at MathWorks to provide two new ThingSpeak Apps: MATLAB Analysis and MATLAB Visualizations. With these new built-in Apps, the ThingSpeak web service can automatically run MATLAB code. That makes it easier to gain insight into your data.
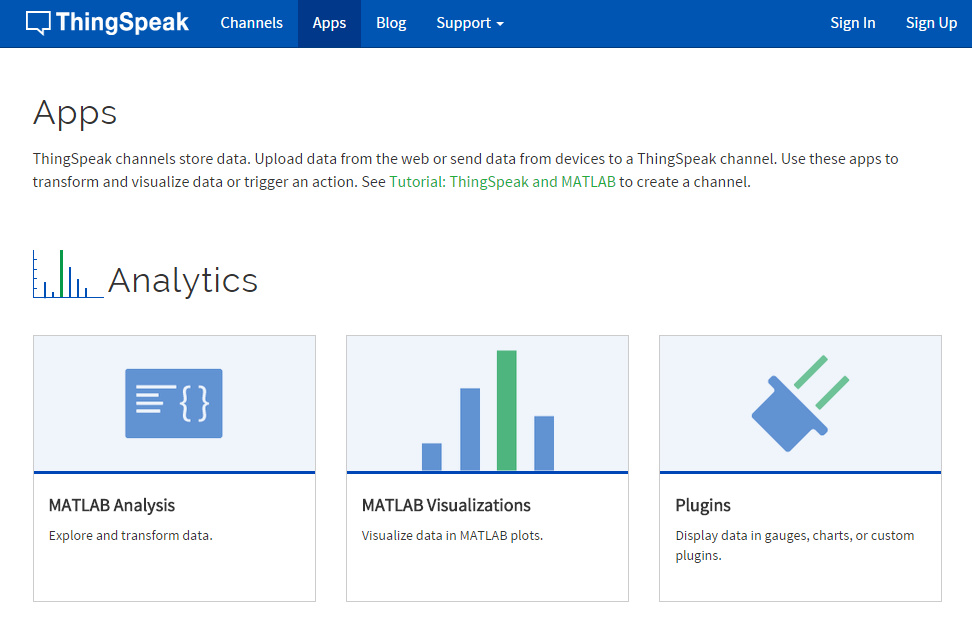
With the MATLAB Analysis app, I am now able to turn my home’s temperature and humidity data into dew point. Dew point is important to find out if the environment is comfortable independent of just knowing the temperature alone. If the dew point is too high or too low, your guests may notice their glasses sweating or that they are uncomfortable.
I am also able to clean up my sensor data and filter out bad data and write it back to a new ThingSpeak channel. From time to time, I see one of my sensors report a really high value, and I’d like to have a way to fix it.
We have provided many MATLAB code examples to get started quickly.
Some of our analysis examples include:
- Calculate Average Humidity
- Calculate Dew point
- Convert Celsius to Fahrenheit
- Eliminate data outliers
- Convert Fahrenheit to Celsius
- Calculate hourly max temperature
- Replace missing values in data
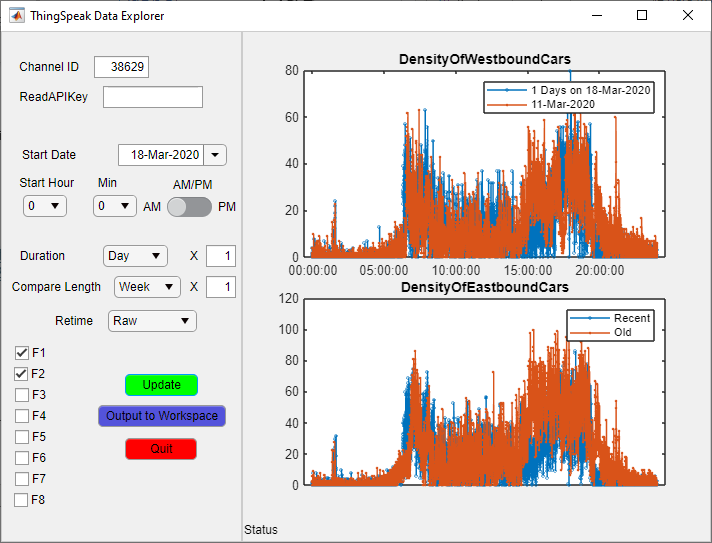
With MATLAB Visualizations, we made it way easier to chart data from multiple data fields. By selecting the “Wind Velocity” example MATLAB Visualization, I can see a plot of the wind velocity data collected by my weather station.
Other visualization examples include:
- View temperature variation over the last 24 hours using a histogram
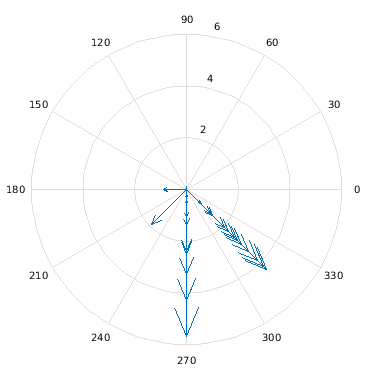
- Plot wind velocity over the last hour using a compass plot
- Understand relative temperature variation
- Plot data from multiple fields
- View temperature and pressure levels
- Visualize relationship between temperature and humidity
Are you looking for an easy way to connect your Arduino or Raspberry Pi devices to ThingSpeak? We have also been working with the MATLAB team at MathWorks on some Hardware Support Packages to help with that. I’ll talk about that in a future blog!
This is really big news for the ThingSpeak Community. I am really excited to see what you do with these new apps. I will share projects on the blog as they come in. Let’s find out together what all of this data means. Get started at ThingSpeak.com!


Comments
To leave a comment, please click here to sign in to your MathWorks Account or create a new one.