IoT Day is the Day to Learn About Our New MATLAB Analytics Features
April 9th is IoT Day! We are celebrating by announcing new IoT Analytic features. All ThingSpeak users now have access to the new features of MATLAB R2017a. In ThingSpeak you can analyze and visualize your data using the power of MATLAB. With the latest updates you can visualize your IoT data as a heatmap and analyze large sets of time-stamped data using a tall timetable.
In the latest update, we have added many new analytics features perfect for IoT data:
- isoutlier / filloutliers: To find outliers in your data, use the isoutlier function. To replace outliers with alternative values, use the filloutliers function.
- smoothdata: Smoothing noisy data is now possible with the smoothdata function. For example, smoothdata(A,’movmedian’) smooths data with a moving-window median.
- fillmissing: Filling missing data using a moving mean or moving median option is now available with the fillmissing function.
Smooth Weather Data
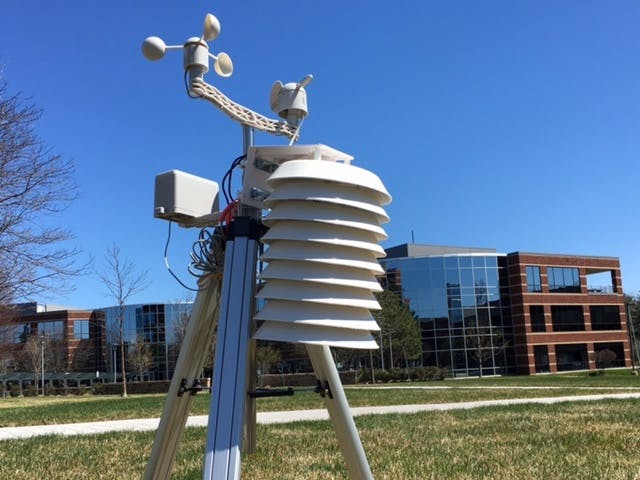
At our headquarters in Natick, MA, we have a weather station sending data to ThingSpeak channel 12397. We use ThingSpeak to collect raw temperature, humidity, wind, and rain data. We use MATLAB to analyze and visualize the data so we can use it for forecasting plant harvesting and building weather models. Learn how to build your own weather station at Hackster.io and learn how to analyze the weather data using MATLAB with the source code on File Exchange.
Often you want to process the raw data by removing outliers and smoothing the data. This helps if you are building a predictive model and to better visualize the data. The common IoT analytics workflow is to read in raw data, synchronize the data in time, detect and remove outlier values, smooth the data, and visualize the data. This example works on ThingSpeak, MATLAB Online, and desktop MATLAB.
Read historic weather data
[weather,channelInfo] = thingSpeakRead(12397,...
'DateRange',[datetime('Feb 04, 2016'),datetime('Feb 10, 2016')],...
'outputFormat','table');
Convert to timetable
weather = table2timetable(weather);
Smooth the data
First, resample the timetable using the retime function so the times and data are uniformly spaced on the minute.
wdata = retime(weather(:,{'Humidity','TemperatureF'}),'minutely','linear');
Smooth the data using a moving median and compare this to the original data. There are a number of moving statistics functions for vectors and matrices like movmean, movmedian, etc and also the smoothdata function which also works on timetables and uses the RowTimes as the sample points. Moving median is the default and other options are available.
smdata = smoothdata(wdata);
Visualize the original and smoothed temperature data on a plot
figure
plot(wdata.Timestamps,wdata.TemperatureF,...
smdata.Timestamps,smdata.TemperatureF,'m--')
legend('Raw Data','Smooth Data')
ylabel('Temperature (\circF)')
title('Temperature Over Time')

Have a happy IoT Day and we hope that you understand your IoT data a littler more by using MATLAB Analytics on ThingSpeak. I would like to thank Heather Gorr for helping me put together the example MATLAB code. Cheers!


댓글
댓글을 남기려면 링크 를 클릭하여 MathWorks 계정에 로그인하거나 계정을 새로 만드십시오.