
How to Chart My Year
I travel a lot. Mostly for work. I do try to take advantage of the priviledge - visiting so many amazing places -- and spend a little extra time occasionally. People even joke that I should be writing a travel blog. Of course I prefer to write one on MATLAB. But how about combining these just for fun today.
Another observation: I find that often people don't include enough information on their plots, from axes labels to good titles. And sometimes the story we want to tell is complex. Including how we present the data. Good labels and titles go a long way to remedying the situation.
You may have noticed some recent posts about a new feature in MATLAB: tiledlayout, meant to supplant subplot. Here are Steve's post and Sean's on POTW.
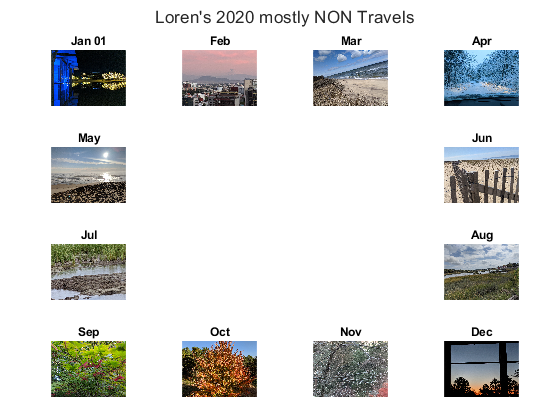
I thought it would be fun to make a "calendar" of sorts for my travels. As the year goes on, I hope to replace the plot each month with an iconic picture from my travels. I will start it off with junk data. And I want to show my meanders a bit as well. For now, again, the plot will be with nonsense data, to be filled in as the year goes on.
Contents
My Calendar
Here's my calendar.
t = tiledlayout(4,4);
title(t,"Loren's 2020 Travels")
t.TileSpacing = "compact";
t.Padding = "compact";
nexttile; plot(rand(3)), title("Jan")
nexttile, plot(magic(3)), title("Feb")
nexttile, plot(rand(3)), title("Mar")
nexttile, plot(rand(3)), title("Apr")
nexttile, plot(rand(3)), title("May")
nexttile(8), plot(rand(3)), title("Jun")
nexttile(9), plot(rand(3)), title("Jul")
nexttile(12), plot(rand(3)), title("Aug")
nexttile(13), plot(rand(3)), title("Sep")
nexttile(14), plot(rand(3)), title("Oct")
nexttile(15), plot(rand(3)), title("Nov")
nexttile(16), plot(rand(3)), title("Dec")
nexttile(6,[2,2]); geoplot([-44 77],[172 20],"m-*")

Maybe I should hold a contest to see if my pictures each month are identifiable. I'll decide that later :-).
Observations
Notice how I lay out my grid of plots, which thankfully has room for 12 months surrounding the central map. Did you know that you could lay out plots so nicely now? And add the all important annotations, plot by plot, including titles and axis labels? Let me know here.


Comments
To leave a comment, please click here to sign in to your MathWorks Account or create a new one.