
GRAMM
Sean's pick this week is gramm by Pierre Morel.
 We can now look at the model results of the separate fits:
Contents
Grouped Plotting
Have you ever wanted to plot things based on a group or a category? If so, Pierre's gramm should likely be your friend. Gramm stands for "Grammar of Graphics for MATLAB" which is inspired from this book. This tool allows for plotting and statistics based on grouping data.Simple Example
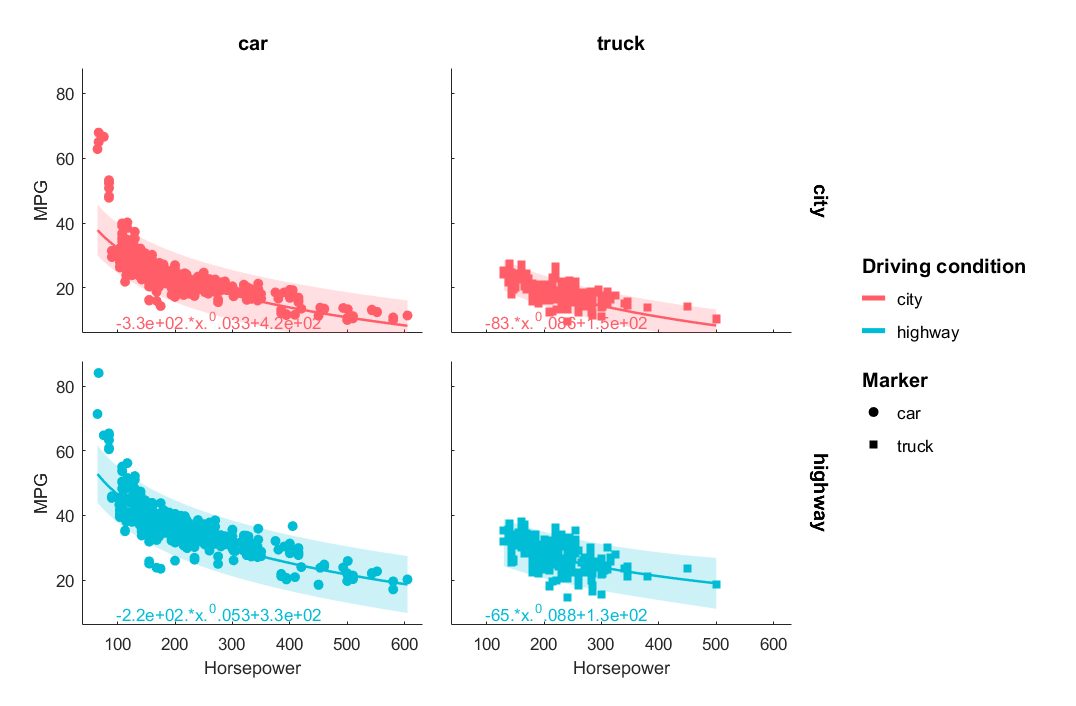
Here is a simple example using fuel economy data that I have stored in a table called CarData. We're going to fit fuel economy to rated horsepower based on whether it is a car or a truck operating in the city or on the highway.g = gramm('x',CarData.RatedHP','y',CarData.MPG,... 'Color',CarData.City_Highway,... 'Marker',CarData.Car_Truck); facet_grid(g,CarData.City_Highway,CarData.Car_Truck,'scale','fixed'); geom_point(g); stat_fit(g,'fun',@(a,b,c,x)a.*x.^b+c,'disp_fit',true,'StartPoint',[1 1 21]); set_names(g,'x','Horsepower','y','MPG','column','Vehicle class','color','Driving condition','column','','row',''); draw(g);
We can now look at the model results of the separate fits:
g.results.stat_fit.model
ans =
     General model:
     ans(x) = a.*x.^b+c
     Coefficients (with 95% confidence bounds):
       a =      -331.9  (-2840, 2177)
       b =     0.03341  (-0.1808, 0.2476)
       c =       419.4  (-2125, 2964)
ans =
     General model:
     ans(x) = a.*x.^b+c
     Coefficients (with 95% confidence bounds):
       a =      -82.91  (-684.2, 518.4)
       b =     0.08624  (-0.3401, 0.5125)
       c =       150.1  (-503.6, 803.8)
ans =
     General model:
     ans(x) = a.*x.^b+c
     Coefficients (with 95% confidence bounds):
       a =      -219.4  (-1350, 911.2)
       b =     0.05282  (-0.1593, 0.265)
       c =       326.3  (-842.9, 1496)
ans =
     General model:
     ans(x) = a.*x.^b+c
     Coefficients (with 95% confidence bounds):
       a =      -65.33  (-1142, 1011)
       b =     0.08805  (-0.8959, 1.072)
       c =       131.9  (-1041, 1305)
Rather than trying to come up with a bunch of examples on my own, I went ahead and opened Pierre's example script as a Live Script and exported it to html. His example script provides a lot of different examples for the comprehensive range of capabilities.
In additon to the examples, there is also a PDF "cheat sheet" to learn the common parameters you can add. While working with
gramm, I kept it open the entire time.
Suggestions
Author Update Pierre released a new version of gramm at the beginning of May 2016 that has implemented the suggestions below! For the third suggestion, you can now parent it to a figure, uitab or uipanel. A few suggestions for Pierre:- gramm should work with the categorical data type so that you do not need to cast back to cell strings in order to group.
- In R2014b or newer, the axes handles returned by g.facet_axes_handles could return the handle, not the numeric version of it like in older releases. This allows for tab complete and viewing all properties.
- It would be nice to be able to specify an axes or collection of existing axes as a 'Parent' so that you can use gramm within a user interface. I don't see any simple way to do this right now other than using copyobj a bunch of times on an invisible figure gramm creates.
Comments
Give it a try and let us know what you think here or leave a comment for Pierre. Published with MATLAB® R2016a- Category:
- Picks


Comments
To leave a comment, please click here to sign in to your MathWorks Account or create a new one.