
Get your subplots the way you want it with subplotHelper
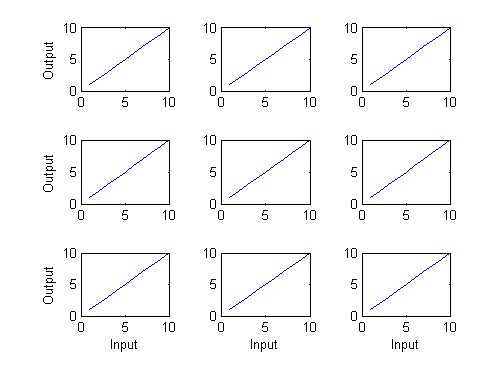
figure
subplot(3,3,1), text(0.5,0.5,"1","FontSize",24,"Color","red")
subplot(3,3,2), text(0.5,0.5,"2","FontSize",24,"Color","red")
subplot(3,3,3), text(0.5,0.5,"3","FontSize",24,"Color","red")
subplot(3,3,[4 7]), text([.5 .5],[.25 .75],["7" "4"],"FontSize",24,"Color","red")
subplot(3,3,[5 9]), text([.25 .25 .75 .75],[.25 .75 .25 .75],["8" "5" "9" "6"],"FontSize",24,"Color","red")

As you can see, the third input argument to subplot can be a vector that specifies the corners of the rectangular region. It's not too complicated, but it does require some thought to figure out the appropriate parameters.
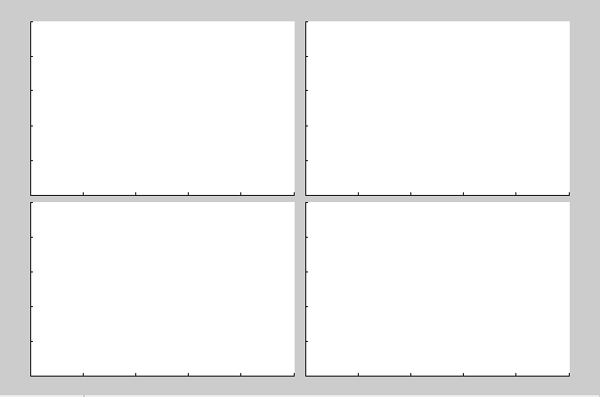
subplotHelper helps you get these parameters by allowing you to interactively select the layout. Here's the tool in action.
Very nice!
Check out tiledlayout (introduced in R2019b)
On a related note, if you're using R2019b or later, check out the new function tiledlayout and nexttile. These give you a bit more control and additional capabilities for axes layout over subplot. One of my favorite features of tiledlayout is the "flow" option that automatically adjusts the layout based on the figure size and shape.
Of course, tiledlayout can have non-uniform distribution, just like with subplot.
Comments
- 범주:
- Picks


댓글
댓글을 남기려면 링크 를 클릭하여 MathWorks 계정에 로그인하거나 계정을 새로 만드십시오.