 Cleve’s Corner: Cleve Moler on Mathematics and Computing
 The MATLAB Blog
 Guy on Simulink
 MATLAB Community
 Artificial Intelligence
 Developer Zone
 Stuart’s MATLAB Videos
 Behind the Headlines
 File Exchange Pick of the Week
 Hans on IoT
 Student Lounge
 MATLAB ユーザーコミュニティー
 Startups, Accelerators, & Entrepreneurs
 Autonomous Systems
 Quantitative Finance
 MATLAB Graphics and App Building
All about pixel colors: Grayscale and binary images
In my previous postings on this topic, I've discussed the basic image display models in MATLAB - truecolor and indexed. The
Image Processing Toolbox has conventions for two additional image display models: grayscale and binary.
 As far as MATLAB itself is concerned, this is a scaled indexed image being displayed in a figure with a grayscale colormap
installed. Here are the key properties that have been set to control the image display:
As far as MATLAB itself is concerned, this is a scaled indexed image being displayed in a figure with a grayscale colormap
installed. Here are the key properties that have been set to control the image display:

Contents
Grayscale image display
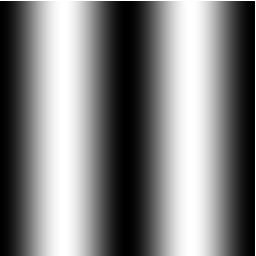
If you pass a single argument to the toolbox's two main image display functions (imtool and imshow), they'll interpret the input as a grayscale image. Here's an illustration using a simple sinusoid:theta = linspace(0, 2*pi, 256);
I = repmat((-cos(2*theta) + 1)/2, [256 1]);
h = imshow(I); % Save the handle for use below.
As far as MATLAB itself is concerned, this is a scaled indexed image being displayed in a figure with a grayscale colormap
installed. Here are the key properties that have been set to control the image display:
get(h, 'CDataMapping')
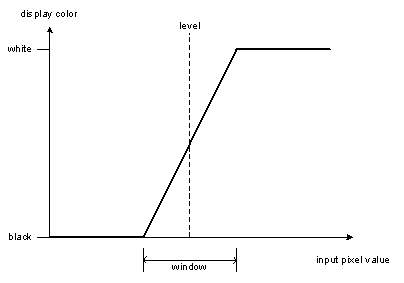
ans =

scaled
The toolbox convention is that, for floating-point images, 0 is displayed as black and 1 is displayed as white.
get(gca, 'CLim')
ans =

     0     1
map = get(gcf, 'Colormap');
map(1:5, :)                   % Display the first few colormap colors
ans =

         0         0         0
    0.0039    0.0039    0.0039
    0.0078    0.0078    0.0078
    0.0118    0.0118    0.0118
    0.0157    0.0157    0.0157
imshow (and imtool) handle all these details for you.
Controlling the grayscale display range
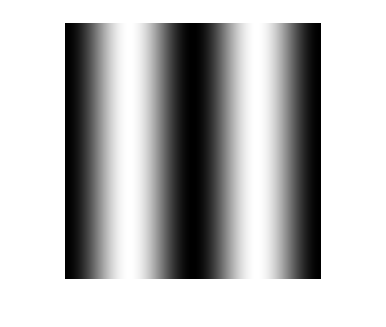
imshow and imtool allow you to override the conventional display range and specify your own black and white values. You do this by providing a second input argument, a two-element vector containing the black and white values. In the call to imshow below, 0.4 (and any lower value) gets displayed as black. The value 0.6 (and any higher value) gets displayed as white.imshow(I, [0.4 0.6])
Binary image display
The other Image Processing Toolbox image display model is the binary image. If you supply a single input argument that is logical, then imtool and imshow (as well as many other toolbox functions) interpret that input as a binary image.bw = imread('text.png');
islogical(bw)
ans =

     1
h = imshow(bw);


Comments
To leave a comment, please click here to sign in to your MathWorks Account or create a new one.