 Cleve’s Corner: Cleve Moler on Mathematics and Computing
 The MATLAB Blog
 Guy on Simulink
 MATLAB Community
 Artificial Intelligence
 Developer Zone
 Stuart’s MATLAB Videos
 Behind the Headlines
 File Exchange Pick of the Week
 Hans on IoT
 Student Lounge
 MATLAB ユーザーコミュニティー
 Startups, Accelerators, & Entrepreneurs
 Autonomous Systems
 Quantitative Finance
 MATLAB Graphics and App Building
Superimposing line plots on images
Several people have asked me recently how to plot some kind of shape on top of an image, so I thought I'd show the basic technique
here. Essentially, you display the image, then call hold on, and then use plot or some other graphics command to superimpose the desired shape.
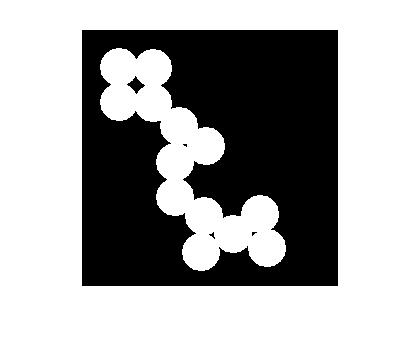
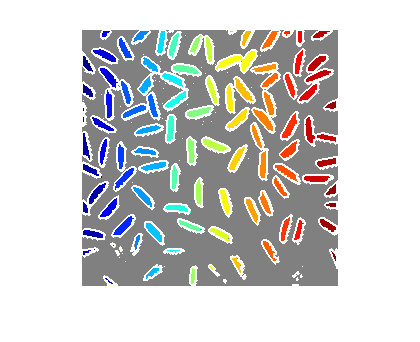
For my first example, I'll superimpose the boundaries found by the bwboundaries function on top of the original binary image.
 Now call hold on. This causes subsequent plotting commands to add to what's already in the figure, instead of replacing it.
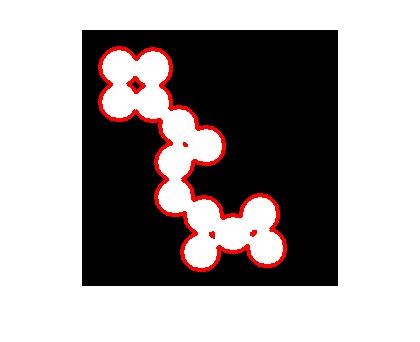
 Finally, call plot to superimpose the boundary locations.
 It's good to get in the habit of calling hold off when you're done adding plot elements. That way, the next high-level plotting command will start over, which is usually
what is expected.
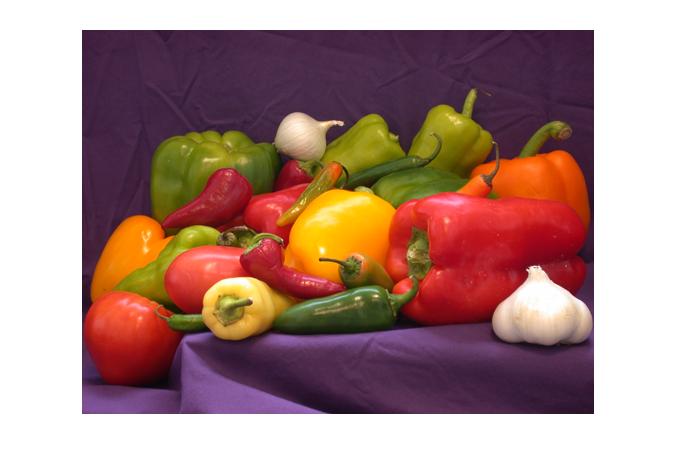
My second example shows how to superimpose a 25-pixel-by-25-pixel grid on an image. (See Natasha's blog comment.) Display the image first, and then call hold on.
It's good to get in the habit of calling hold off when you're done adding plot elements. That way, the next high-level plotting command will start over, which is usually
what is expected.
My second example shows how to superimpose a 25-pixel-by-25-pixel grid on an image. (See Natasha's blog comment.) Display the image first, and then call hold on.
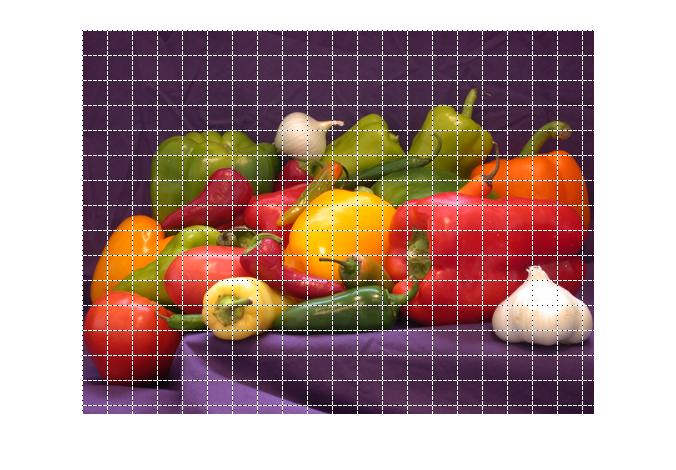
 Now superimpose the grid. To make sure the grid is visible over all pixel colors, I'll use the trick of superimposing two
line objects with contrasting colors and line styles. The Pixel Region Tool in the Image Processing Toolbox uses this same trick.
Now superimpose the grid. To make sure the grid is visible over all pixel colors, I'll use the trick of superimposing two
line objects with contrasting colors and line styles. The Pixel Region Tool in the Image Processing Toolbox uses this same trick.
 Published with MATLAB® 7.3
bw = imread('circles.png');
b = bwboundaries(bw);
imshow(bw)
Now call hold on. This causes subsequent plotting commands to add to what's already in the figure, instead of replacing it.
hold on
Finally, call plot to superimpose the boundary locations.
for k = 1:numel(b)
    plot(b{k}(:,2), b{k}(:,1), 'r', 'Linewidth', 3)
end
It's good to get in the habit of calling hold off when you're done adding plot elements. That way, the next high-level plotting command will start over, which is usually
what is expected.
My second example shows how to superimpose a 25-pixel-by-25-pixel grid on an image. (See Natasha's blog comment.) Display the image first, and then call hold on.
clf
rgb = imread('peppers.png');
imshow(rgb)
hold on
Now superimpose the grid. To make sure the grid is visible over all pixel colors, I'll use the trick of superimposing two
line objects with contrasting colors and line styles. The Pixel Region Tool in the Image Processing Toolbox uses this same trick.
M = size(rgb,1);
N = size(rgb,2);

for k = 1:25:M
    x = [1 N];
    y = [k k];
    plot(x,y,'Color','w','LineStyle','-');
    plot(x,y,'Color','k','LineStyle',':');
end

for k = 1:25:N
    x = [k k];
    y = [1 M];
    plot(x,y,'Color','w','LineStyle','-');
    plot(x,y,'Color','k','LineStyle',':');
end

hold off
Published with MATLAB® 7.3


Comments
To leave a comment, please click here to sign in to your MathWorks Account or create a new one.