How im2html works
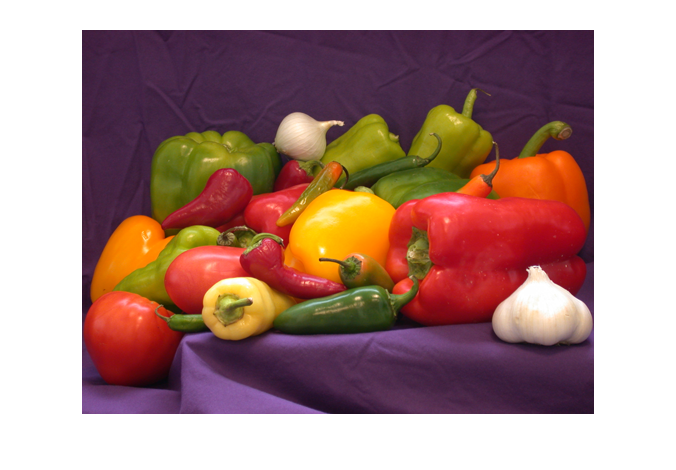
On June 2 I showed you how to make a table with image colors and pixels appear when you publish your MATLAB scripts to HTML using the publish function. The result looks like this:
rgb = imread('peppers.png');
disp(im2html(rgb(88:92,200:204,:)))
|
R:80 G:50 B:77 |
R:78 G:47 B:74 |
R:76 G:47 B:71 |
R:95 G:65 B:73 |
R:158 G:129 B:117 |
|
R:76 G:47 B:77 |
R:75 G:46 B:71 |
R:91 G:63 B:72 |
R:158 G:130 B:119 |
R:192 G:165 B:141 |
|
R:77 G:45 B:70 |
R:82 G:51 B:63 |
R:148 G:120 B:114 |
R:192 G:166 B:146 |
R:203 G:176 B:153 |
|
R:75 G:43 B:65 |
R:126 G: 95 B: 97 |
R:186 G:160 B:145 |
R:197 G:173 B:154 |
R:208 G:180 B:160 |
|
R:100 G: 70 B: 72 |
R:174 G:146 B:135 |
R:193 G:169 B:151 |
R:198 G:175 B:158 |
R:211 G:189 B:170 |
Today I want to follow up with a few details about how this works.
First, I am taking advantage of the ability when publishing a MATLAB script to embed dynamically-generated HTML. To see how that works, let's start with some fixed HTML.
str = ['<html>' ...
    '<span style="color:white; background-color:black;">' ...
    'White text on black background' ...
    '</span>' ...
    '</html>'];
disp(str)
White text on black background
To make a simple dynamic example, let's make a random background color and then automatically assign the foreground color to be white or black, depending on how dark the background color is.
bg_color = rand(1,3)
bg_color =

    0.3404    0.5853    0.2238
bg_as_gray = rgb2gray(bg_color)
bg_as_gray =

    0.4709    0.4709    0.4709
if bg_as_gray(1) > 0.6
    fg_color = 'black';
else
    fg_color = 'white';
end

fg_color
fg_color =

white
Now make the HTML string again, this time inserting the dynamically generated colors. (First, though, convert the background color RGB values to be uint8 in the range [0,255].)
bg_color = im2uint8(bg_color);
str = sprintf(['<html>' ...
    '<span style="color:%s; background-color:rgb(%d,%d,%d);">' ...
    'Contrasting text on randomly colored background' ...
    '</span>' ...
    '</html>'], fg_color, bg_color(1), bg_color(2), bg_color(3));
disp(str)
Contrasting text on randomly colored background
So the im2html function simply produces an HTML table with dynamically generated table cell colors and pixel-value text strings. Here's an illustrative sample of the generated HTML:
<table class="image-table">
  <tr class="image-table-row">
    <!-- ROW: 1  COL: 1 -->
    <td class="dark-pixel-cell" style="background-color:#50324D; width:5.0em; height:5.0em">
      R:80<br \>G:50<br \>B:77
    </td>
Now we know the basics of dynamically generating some HTML and rendering it in your published output. How do we use that to generate our image pixel-color tables? It's more complicated than you might think.
First, remember that the MATLAB image display model is very flexible. The relationship between a pixel value and the actual color displayed on the screen can depend on these various factors:
- Whether the image is in truecolor or indexed format
- The data type of the pixel array
- The figure's colormap
- The axes object's CLim property
(I wrote a whole series of blog posts about this topic way back when.)
Second, it can be complicated to figure out how to format the pixel-value text for all the different cases. Sometimes there is one value, sometimes three, sometimes both an index and a colormap value, sometimes the values integers, sometimes floating, ...
You get the idea.
Well, there's a tool in the Image Processing Toolbox called imagemodel that provides these services. We don't talk about it very much because we think it's not particularly useful to most toolbox users. However, if you are doing GUI programming involving images, it might come in handy.
imagemodel takes a Handle Graphics image handle and returns an object that you can query.
h = imshow('peppers.png');

model = imagemodel(h)
model =

IMAGEMODEL object accessing an image with these properties:

       ClassType: 'uint8'
    DisplayRange: []
     ImageHeight: 384
       ImageType: 'truecolor'
      ImageWidth: 512
    MinIntensity: []
    MaxIntensity: []
Here's how to get the RGB screen display color for a particular pixel:
getScreenPixelRGBValue(model, 5, 10)
ans =

    0.2588    0.1216    0.2510
I can get the RGB screen display color exactly the same way, even for a completely different kind of image. Below is a gray-scale image displayed with a black-to-white range of [-1,1].
theta = linspace(-pi,pi,200);
I = repmat(sin(theta),200,1);
h2 = imshow(I,[-1 1])
h2 =

  347.0363

model2 = imagemodel(h2);
getScreenPixelRGBValue(model2, 23, 47)
ans =

    0.0039    0.0039    0.0039
For getting pixel-value text strings, you have to ask the image model for a function handle that does the work. Then you can call the function handle. Here's how that would work for the sample image just above.
f = getPixelRegionFormatFcn(model2);
f(75, 128)
ans =

    '0.76'
This is a fairly obscure corner of the Image Processing Toolbox, but I thought some of you might be interested to get a peek into how tools such as the Pixel Region Tool work.
![]()


Comments
To leave a comment, please click here to sign in to your MathWorks Account or create a new one.