
Making an HTML table of pixel values with colored cells
Today's post shows you how to make a table with image colors and pixels appear when you publish your MATLAB scripts to HTML using the publish function. The result looks like this:
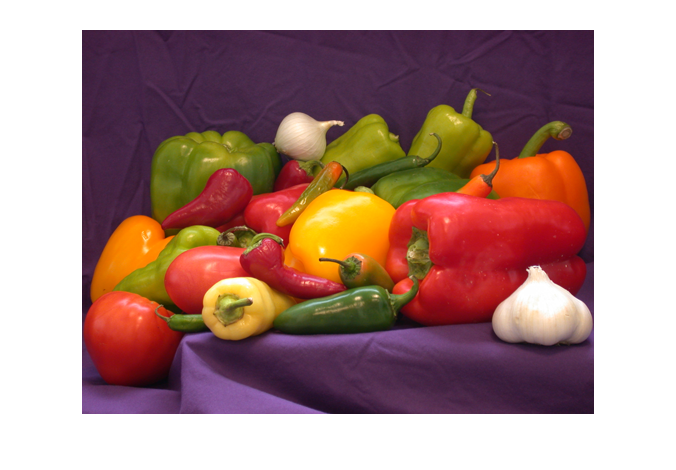
rgb = imread('peppers.png');
disp(im2html(rgb(88:92,200:204,:)))
|
R:80 G:50 B:77 |
R:78 G:47 B:74 |
R:76 G:47 B:71 |
R:95 G:65 B:73 |
R:158 G:129 B:117 |
|
R:76 G:47 B:77 |
R:75 G:46 B:71 |
R:91 G:63 B:72 |
R:158 G:130 B:119 |
R:192 G:165 B:141 |
|
R:77 G:45 B:70 |
R:82 G:51 B:63 |
R:148 G:120 B:114 |
R:192 G:166 B:146 |
R:203 G:176 B:153 |
|
R:75 G:43 B:65 |
R:126 G: 95 B: 97 |
R:186 G:160 B:145 |
R:197 G:173 B:154 |
R:208 G:180 B:160 |
|
R:100 G: 70 B: 72 |
R:174 G:146 B:135 |
R:193 G:169 B:151 |
R:198 G:175 B:158 |
R:211 G:189 B:170 |
I was inspired to do something like this when I saw Printing Variables to HTML Tables in Published Code (by Ned) on the File Exchange a while back. It also produces an HTML table with colored cells and superimposed values.
I was also thinking about the Pixel Region Tool in the Image Processing Toolbox. Here's a screen shot:
![]()
I wanted to go a bit further than Ned's original. I wanted to handle all the different kinds of image types (grayscale, truecolor, indexed with direct mapping, indexed with scaled mapping). I also wanted to replicate the feature of the Pixel Region Tool that automatically changed the color of the superimposed text depending on whether the underlying pixel was dark or light. (You can see that effect in the screen shot above.)
I've packaged all this in a function called im2html. You can download this function from the File Exchange.
Here are some examples showing how to use im2html with different types of images.
Display a table of values for a gray-scale image:
I = imread('pout.tif');
disp(im2html(I(125:134, 104:114)))
| 112 | 112 | 107 | 97 | 91 | 87 | 86 | 84 | 83 | 84 | 84 |
| 120 | 126 | 128 | 128 | 114 | 101 | 87 | 87 | 86 | 86 | 87 |
| 116 | 132 | 138 | 142 | 142 | 132 | 98 | 91 | 89 | 87 | 89 |
| 110 | 133 | 145 | 150 | 149 | 147 | 121 | 101 | 93 | 93 | 91 |
| 109 | 133 | 145 | 156 | 159 | 153 | 142 | 130 | 109 | 102 | 99 |
| 109 | 131 | 143 | 154 | 169 | 171 | 169 | 169 | 154 | 139 | 137 |
| 108 | 126 | 142 | 151 | 169 | 175 | 186 | 190 | 189 | 180 | 179 |
| 110 | 121 | 137 | 148 | 158 | 167 | 177 | 187 | 199 | 189 | 185 |
| 112 | 117 | 136 | 146 | 151 | 159 | 159 | 163 | 189 | 189 | 180 |
| 114 | 113 | 132 | 142 | 147 | 151 | 156 | 154 | 162 | 184 | 179 |
I = magic(10);
disp(im2html(I,[]))
| 92 | 99 | 1 | 8 | 15 | 67 | 74 | 51 | 58 | 40 |
| 98 | 80 | 7 | 14 | 16 | 73 | 55 | 57 | 64 | 41 |
| 4 | 81 | 88 | 20 | 22 | 54 | 56 | 63 | 70 | 47 |
| 85 | 87 | 19 | 21 | 3 | 60 | 62 | 69 | 71 | 28 |
| 86 | 93 | 25 | 2 | 9 | 61 | 68 | 75 | 52 | 34 |
| 17 | 24 | 76 | 83 | 90 | 42 | 49 | 26 | 33 | 65 |
| 23 | 5 | 82 | 89 | 91 | 48 | 30 | 32 | 39 | 66 |
| 79 | 6 | 13 | 95 | 97 | 29 | 31 | 38 | 45 | 72 |
| 10 | 12 | 94 | 96 | 78 | 35 | 37 | 44 | 46 | 53 |
| 11 | 18 | 100 | 77 | 84 | 36 | 43 | 50 | 27 | 59 |
Display a table of values from an indexed image:
[X,map] = imread('trees.tif');
disp(im2html(X(156:160,244:248),map))
|
<93> R:0.42 G:0.68 B:0.87 |
<93> R:0.42 G:0.68 B:0.87 |
<82> R:0.35 G:0.65 B:0.81 |
<77> R:0.39 G:0.61 B:0.81 |
<93> R:0.42 G:0.68 B:0.87 |
|
<82> R:0.35 G:0.65 B:0.81 |
<45> R:0.22 G:0.45 B:0.68 |
<50> R:0.42 G:0.42 B:0.52 |
<82> R:0.35 G:0.65 B:0.81 |
<82> R:0.35 G:0.65 B:0.81 |
|
<93> R:0.42 G:0.68 B:0.87 |
<50> R:0.42 G:0.42 B:0.52 |
<32> R:0.39 G:0.29 B:0.55 |
<44> R:0.52 G:0.32 B:0.52 |
<93> R:0.42 G:0.68 B:0.87 |
|
<93> R:0.42 G:0.68 B:0.87 |
<93> R:0.42 G:0.68 B:0.87 |
<44> R:0.52 G:0.32 B:0.52 |
<20> R:0.58 G:0.13 B:0.29 |
<27> R:0.45 G:0.22 B:0.42 |
|
<105> R:0.55 G:0.74 B:0.91 |
<93> R:0.42 G:0.68 B:0.87 |
<77> R:0.39 G:0.61 B:0.81 |
<44> R:0.52 G:0.32 B:0.52 |
<20> R:0.58 G:0.13 B:0.29 |
You can also capture the output of im2html as a string, or write it directly to a file.
s = im2html(magic(10),[]);
im2html(magic(10),[],'OutputFile','magic_table.html')
Give im2html a try. Comment here (or on the File Exchange page) if you find a good use for it, or if you have ideas about making it better.
Next time I'll go into some of the details about how im2html works, including the use of raw HTML in your publishable MATLAB scripts, as well as an obscure thing in the Image Processing Toolbox called imagemodel.


Comments
To leave a comment, please click here to sign in to your MathWorks Account or create a new one.