
How to Go a Little Crazy with Graphics Titles
The title function is the third most commonly-used function in my 13 years of writing this blog, after imshow and imread. You have probably all used this function many times.
But I suspect that even the power users among you might not know half of what this function can do. So let me take you on a little tour.
Contents
- How to Title a Plot
- How to Make a Multiline Title
- How to Title a Legend
- How to Title a Tiled Set of Graphics
- How to Control the Title Font
- How to Put Symbols in the Title
- How to Put Superscripts and Subscripts in the Title
- How to Put Unicode Characters into the Title
- How to Put Math in the Title
- How to Go a Little Crazy with Titles
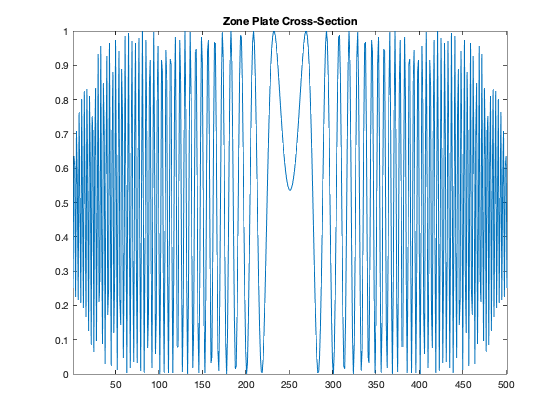
How to Title a Plot
Here's the basic form everyone knows:
A = imzoneplate;
w = A(255,:);
plot(w)
xlim([1 501])
title("Zone Plate Cross-Section")
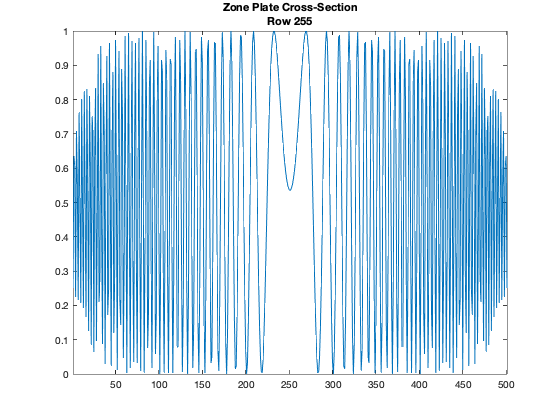
How to Make a Multiline Title
But you can make a multiline title, too, using a string array.
plot(w)
xlim([1 501])
title(["Zone Plate Cross-Section" ; "Row 255"])
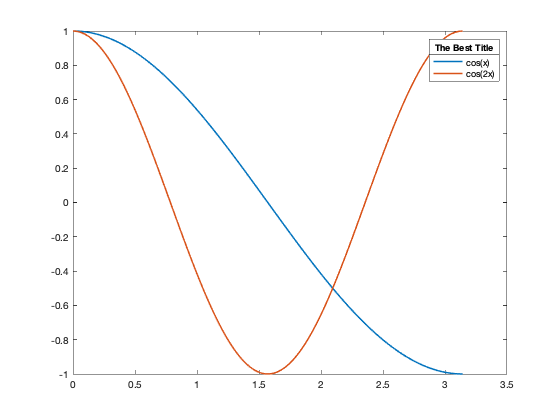
How to Title a Legend
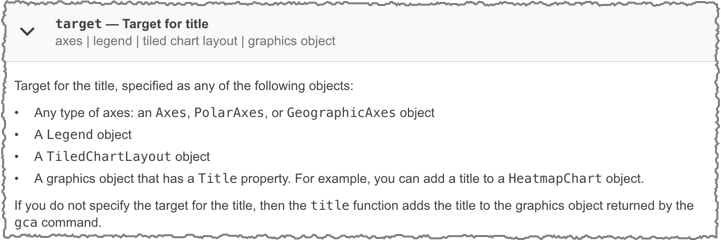
If you read the reference page for title, you'll see that it has this syntax:

The first argument, target, is described this way:
Hey, you can title a legend!
x = linspace(0,pi);
y1 = cos(x);
plot(x,y1)

hold on
y2 = cos(2*x);
plot(x,y2)
hold off

lgd = legend("cos(x)","cos(2x)");
title(lgd,"The Best Title")
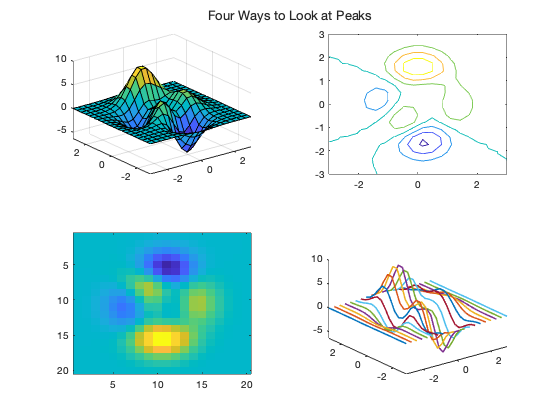
How to Title a Tiled Set of Graphics
The target argument can also be a tiledlayout object, which is a flexible and easy-to-use way to organize a grid of related graphics. (Note: tiledlayout is new in R2019b.)
tl = tiledlayout(2,2);
[X,Y,Z] = peaks(20);

% Tile 1
nexttile
surf(X,Y,Z)

% Tile 2
nexttile
contour(X,Y,Z)

% Tile 3
nexttile
imagesc(Z)

% Tile 4
nexttile
plot3(X,Y,Z)

title(tl,"Four Ways to Look at Peaks")
How to Control the Title Font
Using Name-Value pairs, you can control the font, font size, font weight, and color.
clf
x = @(t) sin(2*t);
y = @(t) sin(3*t);
fplot(x,y,'LineWidth',2)
title("Parametric Plot", ...
    "FontName", "Chalkduster", ...
    "FontSize", 24, ...
    "FontWeight", "bold", ...
    "Color", [0.850 0.325 0.098]);

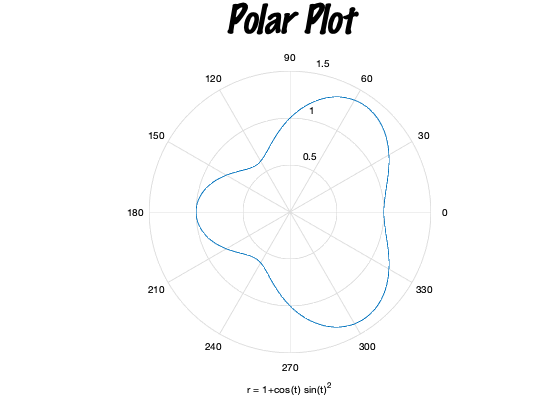
Alternatively, you can call title with an output argument to capture the text object and then set its properties directly, like this:
ezpolar('1+cos(t)*sin(t)^2')
t = title("Polar Plot");
t.FontName = "Marker Felt";
t.FontAngle = "italic";
t.FontSize = 36;
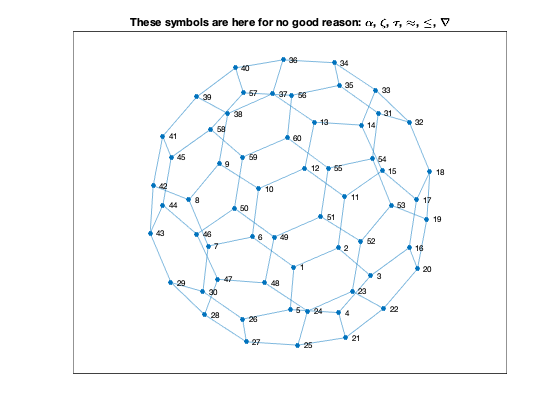
How to Put Symbols in the Title
By default, MATLAB will recognize TeX symbol names in your title text. These include Greek letters (\alpha, \zeta, \tau) and mathematical symbols (\approx, \leq, \nabla).
plot(graph(bucky))
axis equal
title("These symbols are here for no good reason: \alpha, \zeta, \tau" + ...
    ", \approx, \leq, \nabla")
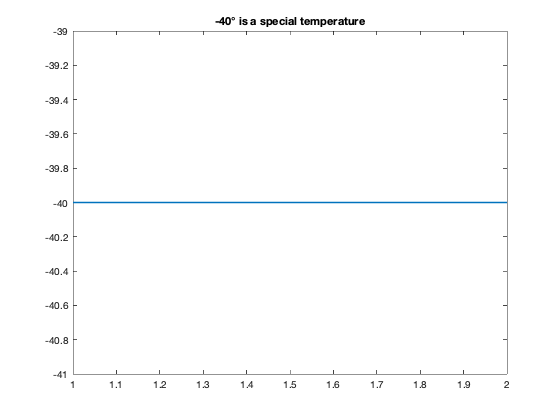
How to Put Superscripts and Subscripts in the Title
Use the TeX notation for superscripts and subscripts.
plot([-40 -40])
title("-40^{\circ} is a special temperature")

How to Put Unicode Characters into the Title
Some people don't like using a superscript "circle" symbol to show degrees and would prefer to use the Unicode degree character. You can get a Unicode character in MATLAB by calling char on the decimal code value. The decimal code value for the degree symbol is 176.
plot([-40 -40])
title("-40" + char(176) + " is a special temperature")
Yeah, that does look better, doesn't it?
How to Put Math in the Title
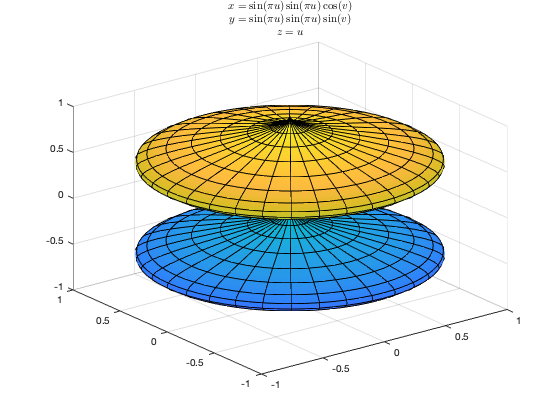
You can put a lot of simple mathematical expressions in the title using the symbols, subscripts, and superscripts of the TeX interpreter, but I think the LaTeX interpreter looks better for real math.
fsurf(@(u,v)sin(pi*u).*sin(pi*u).*cos(v), ...
    @(u,v)sin(pi*u).*sin(pi*u).*sin(v), ...
    @(u,v)u, [-1 1 0 2*pi])
title(["$x = \sin(\pi u) \sin(\pi u) \cos(v)$", ...
    "$y = \sin(\pi u) \sin(\pi u) \sin(v)$", ...
    "$z = u$"], ...
    "Interpreter","latex")
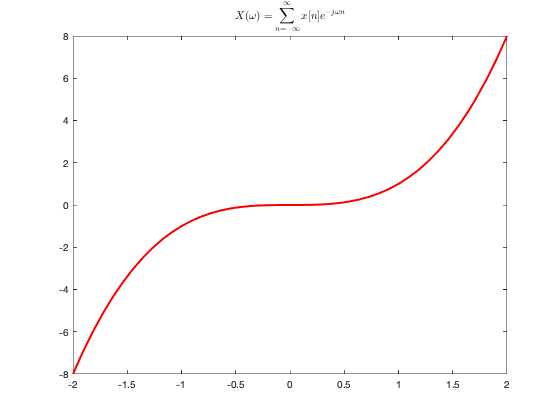
Here's a display-math version of one of my favorite equations, paired with an unrelated graphic.
fplot(@(x) x.^3, [-2 2], 'r', 'LineWidth',2)
title("$$X(\omega) = \sum_{n=-\infty}^{\infty} x[n] e^{-j\omega n}$$",...
    "Interpreter","latex")
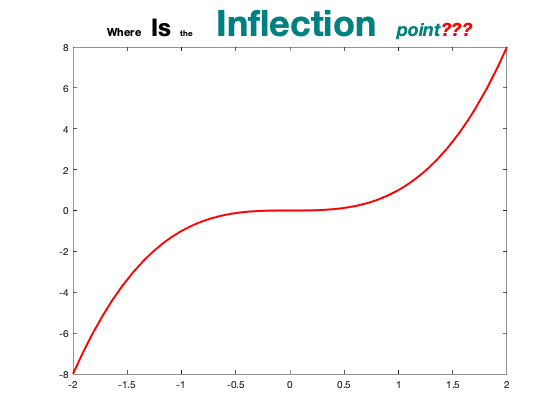
How to Go a Little Crazy with Titles
One of the things I like about the TeX interpreter option is that it lets you change your about about font, font size, font weight, and color. In the middle of the title. As many times as you like.
fplot(@(x) x.^3, [-2 2], 'r', 'LineWidth',2)
title("Where \fontsize{24} Is \fontsize{8} the \fontsize{36} " + ...
    "\color[rgb]{0,0.5,0.5} Inflection \fontsize{18} \it point\color{red}???")
If only I were still in the business of writing journal papers. I would definitely try to sneak in something like that.
Finally, I should note that the title function can also be used to compute the singular value decomposition. But I will have to leave that story for later...


See Also
-

Making Pretty Graphs
Blogs
-
-


Comments
To leave a comment, please click here to sign in to your MathWorks Account or create a new one.