
Double Thresholding
Back in June, my answer to a question on MATLAB Answers used a technique called double thresholding, also known as hysteresis thresholding. Although the question raised was a 1-D problem, I wanted to share with you the general idea in two dimensions, making use of the function imreconstruct.
Double thresholding can be useful when a single threshold produces unsatisfactory results because it either includes too many pixels in the foreground (with a low threshold), or it includes too few (with a high threshold). The idea is to use two thresholds, one that is more selective and one that is less selective, and then let the more selective result "grow" by adding touching pixels from the less selective result.
Here's a simple, contrived example to illustrate what I mean.
A = mat2gray(peaks(200));
imshow(A)
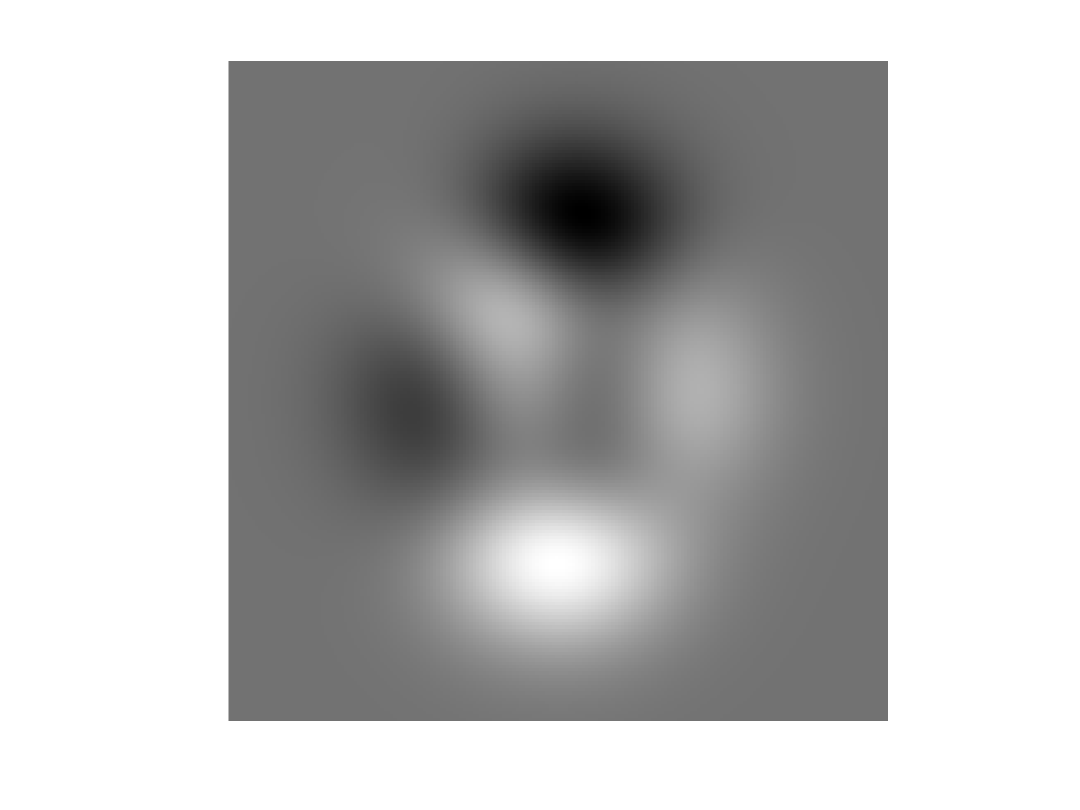
Suppose I want to compute a mask of the peaks that exceed 0.9:
T_high = 0.9;
mask_high = A > T_high;
imshowpair(A,mask_high)
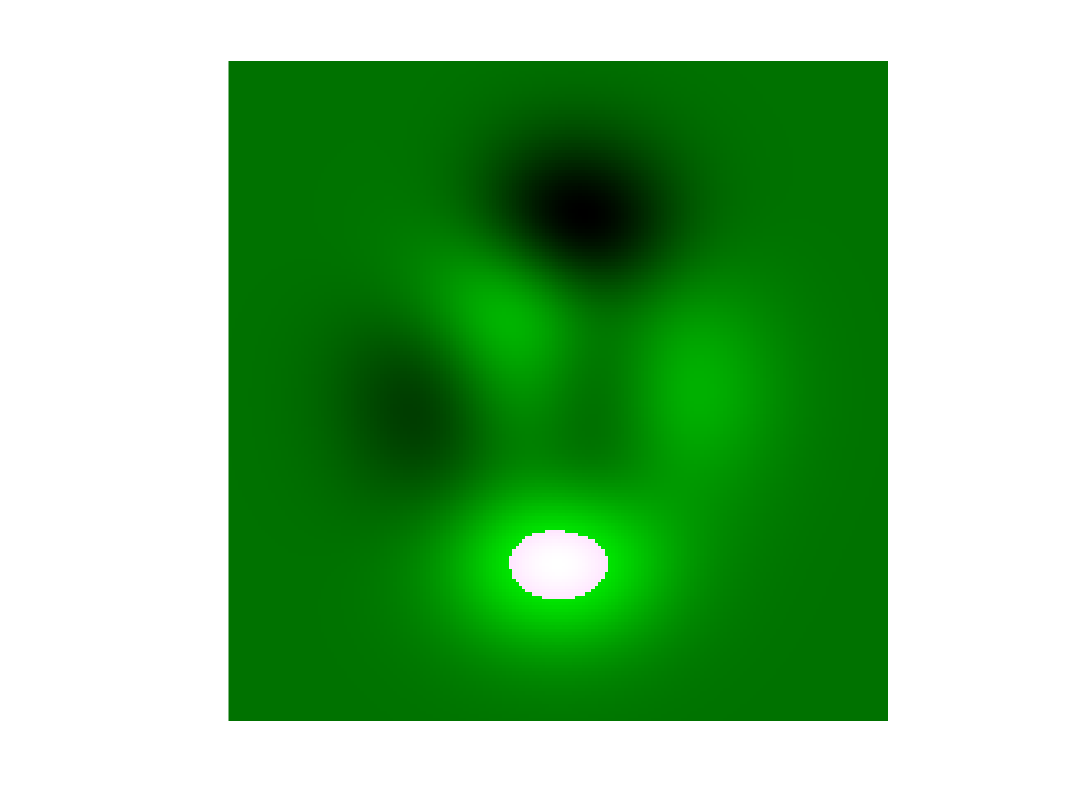
That's good, but I'd like for the mask to include more of the peak, so I try a lower threshold.
T_low = 0.65;
mask_low = A > T_low;
imshowpair(A,mask_low)
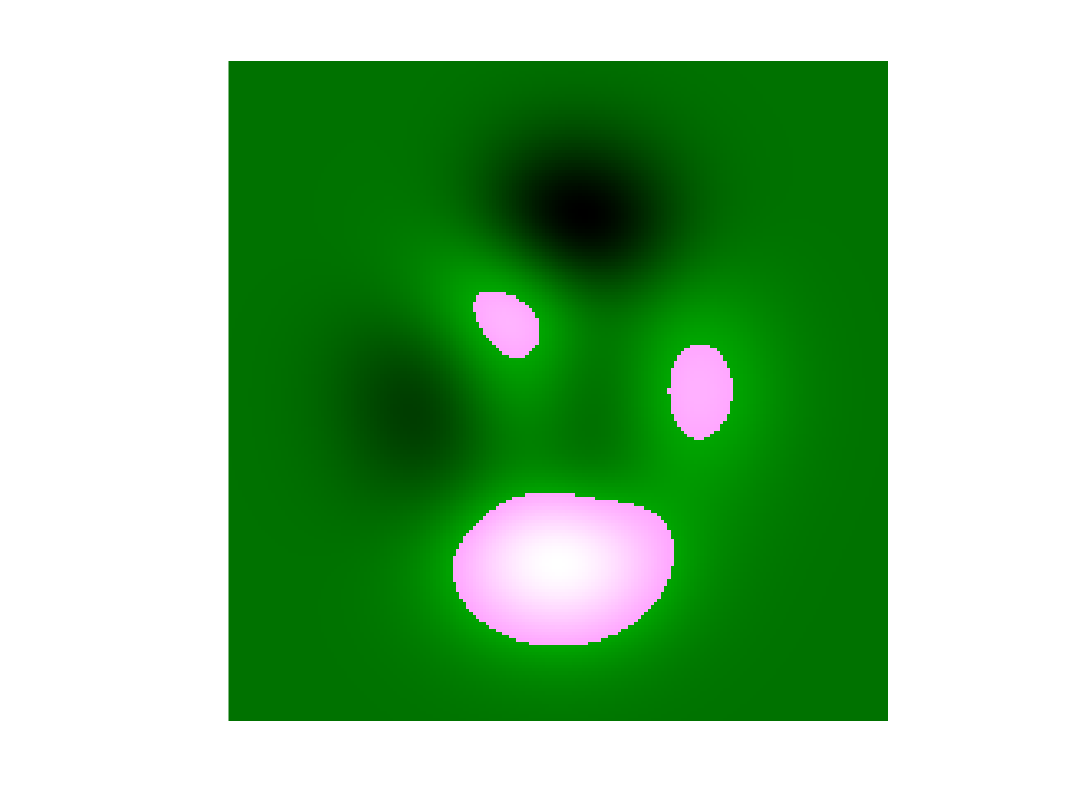
Now the mask includes more of the peak of interest, but it also includes some of the smaller peaks that I don't want.
The double thresholding idea is to use the output from the higher threshold to select all the touching regions in the output from the lower threshold. Morphological reconstruction can do exactly that. The Image Processing Toolbox function to use is imreconstruct.
mask_double = imreconstruct(mask_high,mask_low);
imshowpair(A,mask_double)

Now the mask includes more of the high peak, without also including portions of the lower peaks.
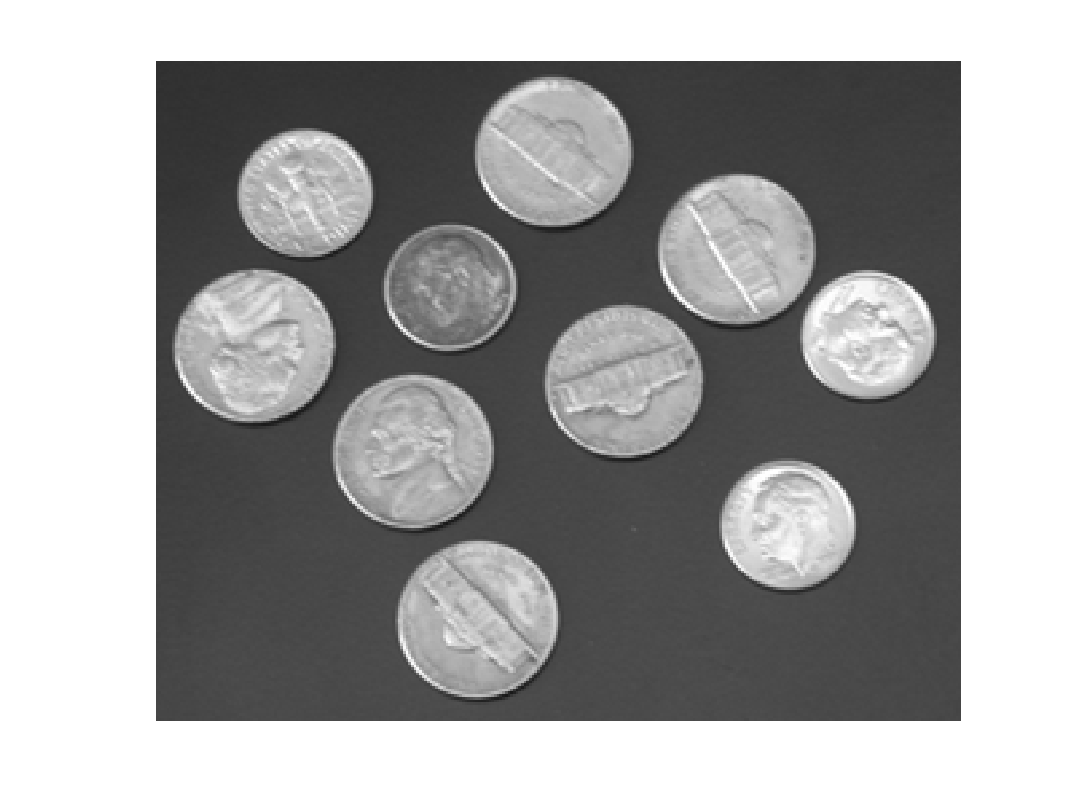
Let's try a slightly less contrived example that uses double thresholding on the gradient magnitude of a grayscale image.
B = imread("coins.png");
imshow(B)
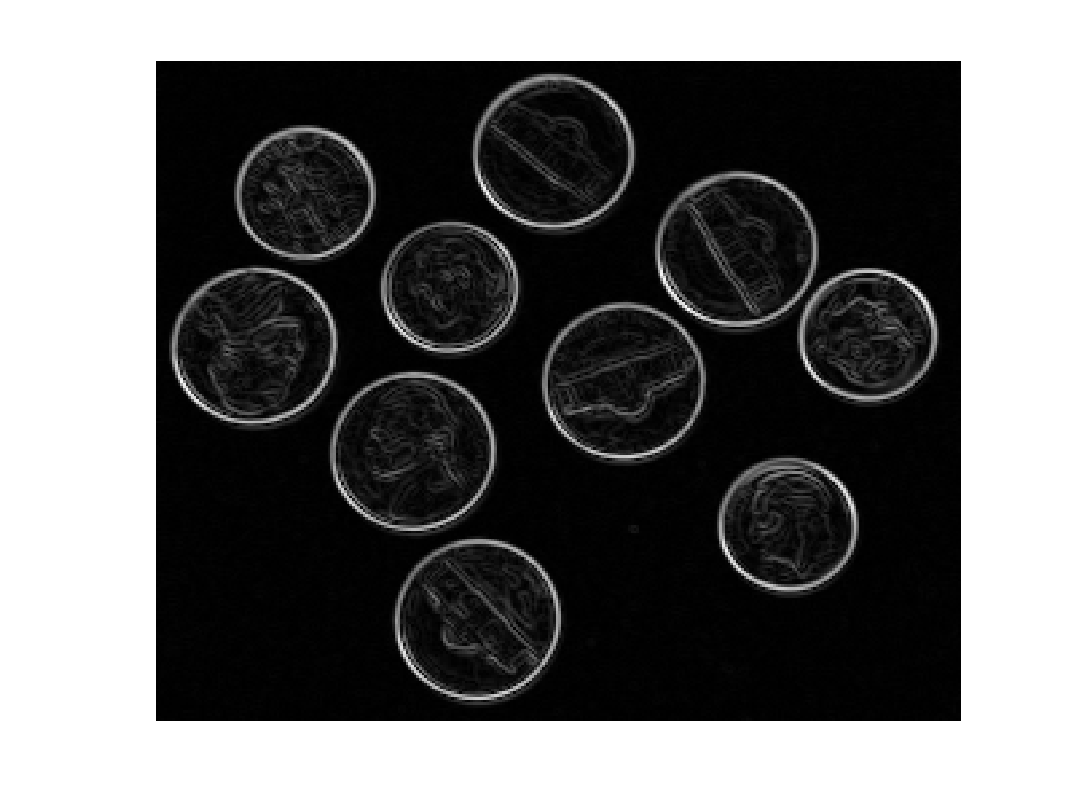
Bg = mat2gray(imgradient(B));
imshow(Bg)
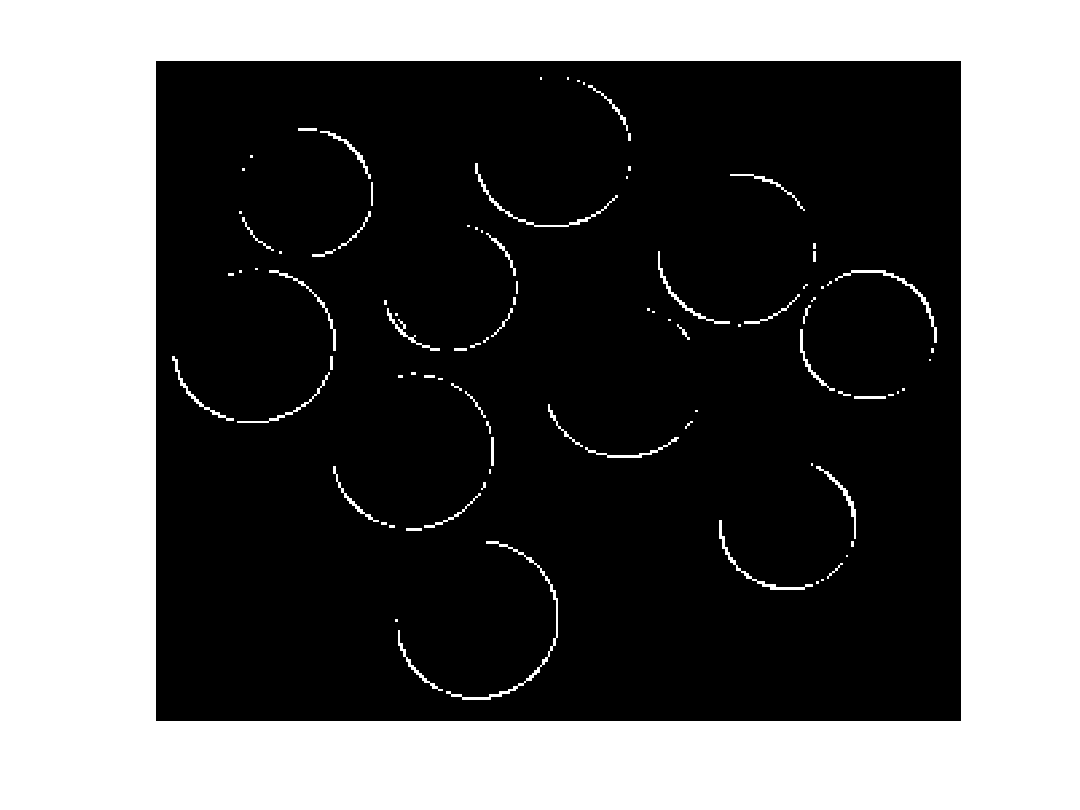
Can we just get the enclosing edges for each coin using a simple threshold?
T_high = 0.6;
Bg_mask_high = Bg > T_high;
imshow(Bg_mask_high)
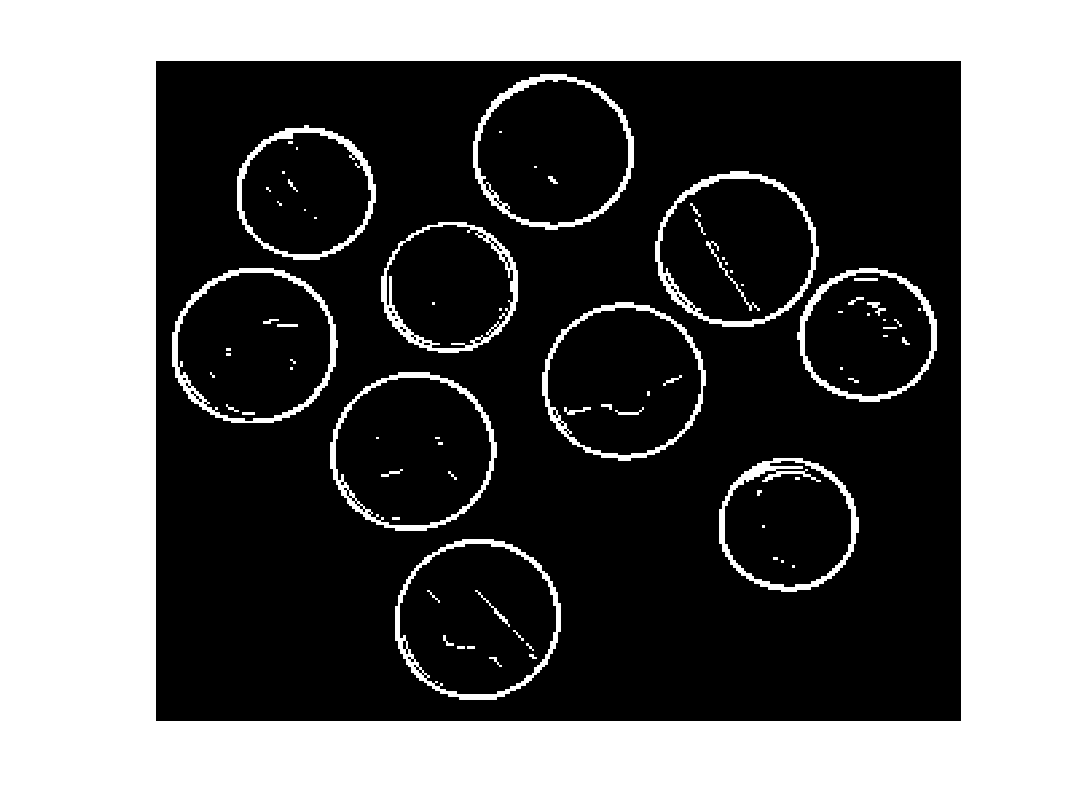
Try a lower threshold:
T_low = 0.3;
Bg_mask_low = Bg > T_low;
imshow(Bg_mask_low)
Now use a double threshold:
Bg_mask_double = imreconstruct(Bg_mask_high,Bg_mask_low);
imshow(Bg_mask_double)

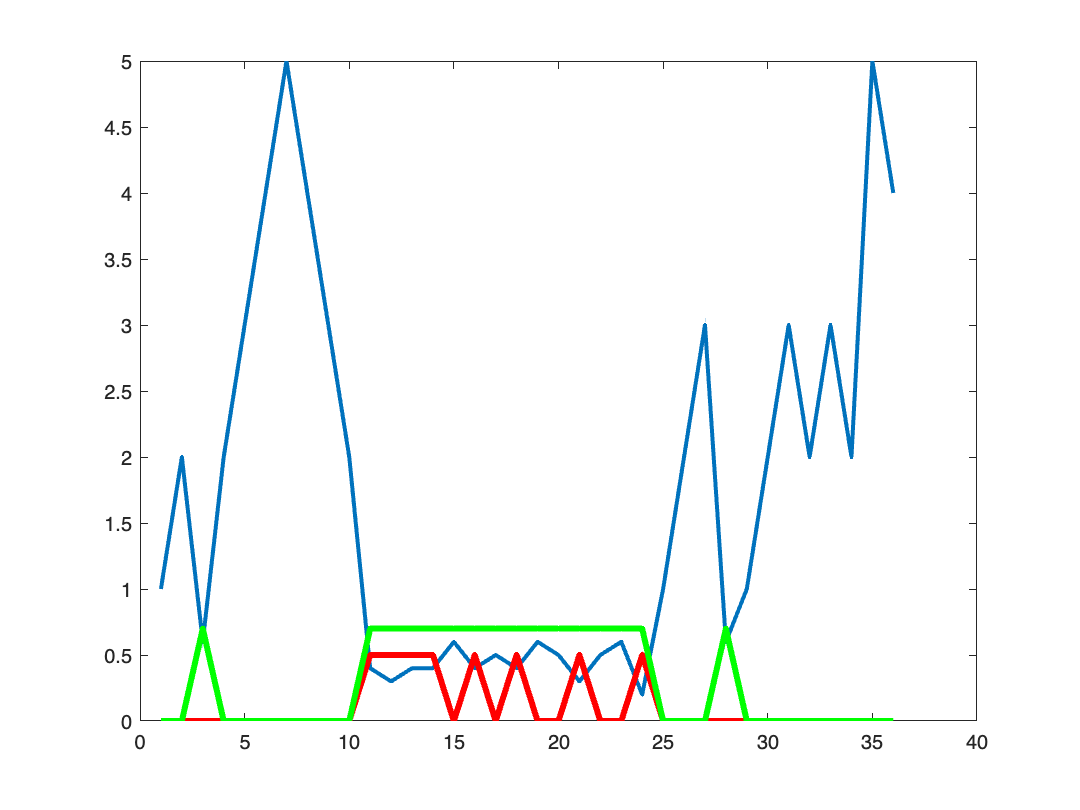
y = [1 2 0.6 2 3 4 5 4 3 2 0.4 0.3 0.4 0.4 0.6 0.4 0.5 0.4 0.6 0.5 ...
0.3 0.5 0.6 0.2 1 2 3 0.6 1 2 3 2 3 2 5 4];
plot(y)
grid on
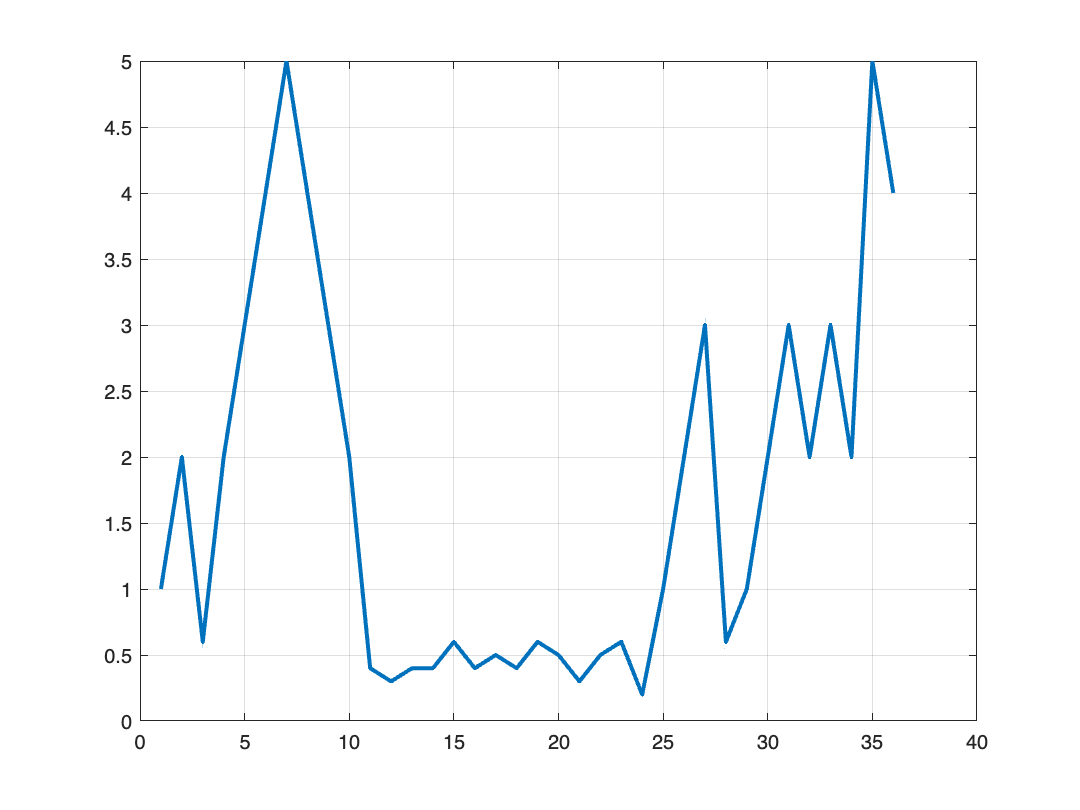
The problem was to extract low portions below 0.5, but using some kind of loose threshold that allowed portions of the clump to be a bit higher than 0.6. The double threshold does the trick nicely.
T_low = 0.5;
mask_low = y < 0.5;
T_high = 0.7;
mask_high = y < T_high;
plot(y)
hold on
plot(T_low*mask_low, LineWidth = 3, Color = "red")
plot(T_high*mask_high, LineWidth = 3, Color = "green")
hold off
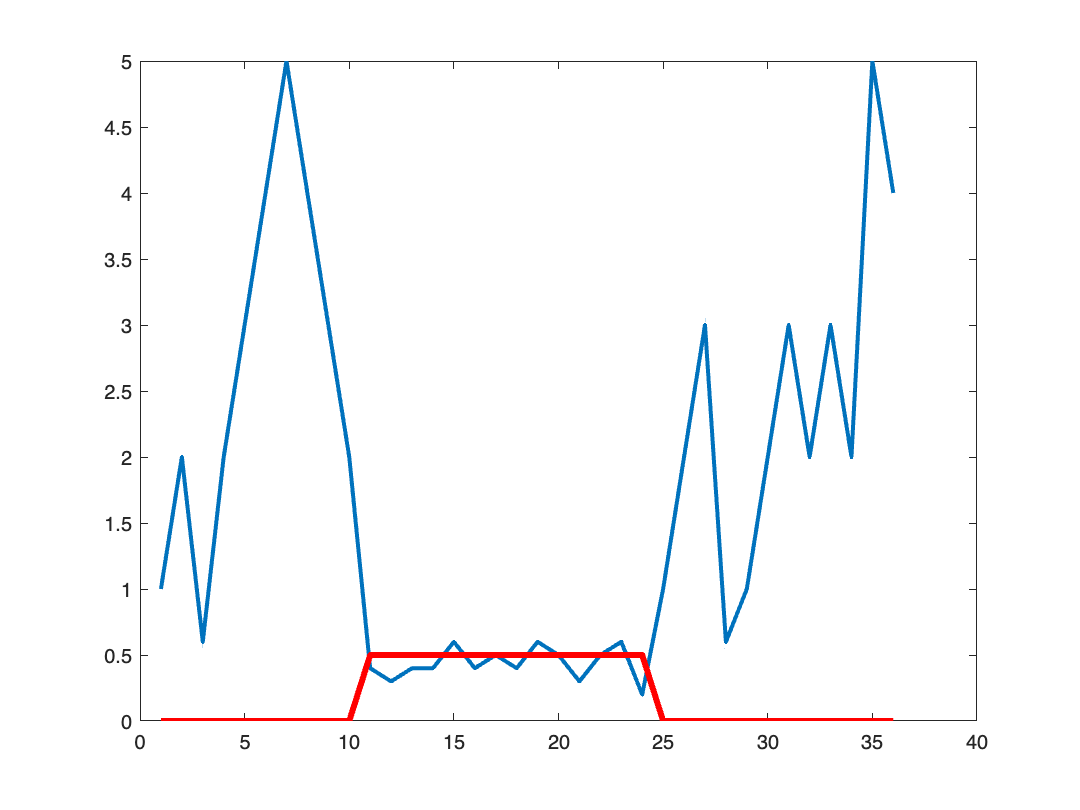
Compute the double threshold using imreconstruct:
mask_double = imreconstruct(mask_low,mask_high);
plot(y)
hold on
plot(T_low*mask_double, LineWidth = 3, Color = "red")
hold off


Comments
To leave a comment, please click here to sign in to your MathWorks Account or create a new one.