ContentsIntroductionFind the image objectGet the spatial coordinates for drawing the outlineConstruct the x- and y-vectorsDraw the linesIntroductionSome years ago, I blogged about how to overlay a... 더 읽어보기 >>

Steve on Image Processing with MATLABImage processing concepts, algorithms, and MATLAB
Note
Steve on Image Processing with MATLAB has been archived and will not be updated.
다음에 대한 결과: repmat

Feret Diameter: Introduction 8

This is the first of a few blog posts about object measurements based on a concept called the Feret diameter, sometimes called the caliper diameter. The diagram below illustrates the concept. Place... 더 읽어보기 >>
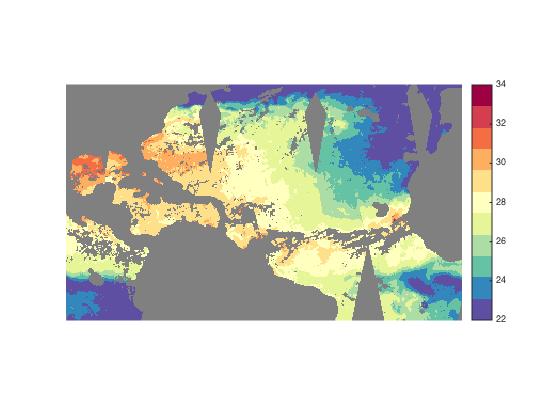
Colormap Test Image 12

Today I want to tell you how and why I made these images: After the MATLAB R2014b release, I wrote several blog posts (Part 1, Part 2, Part 3, and Part 4) about the new default colormap, parula, that... 더 읽어보기 >>
- 범주:
- Colormap
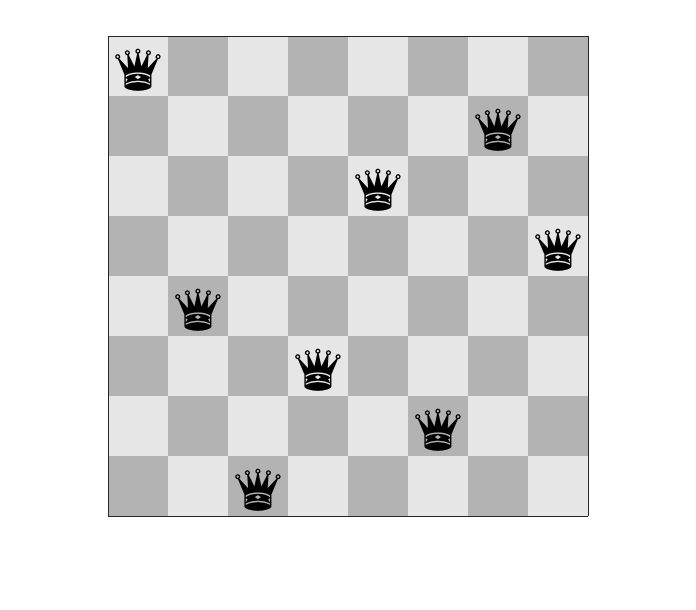
Chessboards, Implicit Expansion, REPELEM, and Unicode Chess Queens 1

A few weeks ago, I wrote about a solver algorithm for the Eight Queens Problem. The post included diagrams like this one. Today I want to show you how I made that diagram in MATLAB. First, let's talk... 더 읽어보기 >>
The Eight Queens Problem – Generating All Solutions
On April 20, I wrote about an algorithm for solving the Eight Queens Problem. In this problem, the task is to place eight queens on a chessboard so that none of the queens is attacking any other... 더 읽어보기 >>
Aliasing and image resizing – part 2 7

In my 03-Jan-2017 post, I introduced my new topic: aliasing, especially as it relates to resizing images. Today I will get more specific about what aliasing actually is.I'll use a 1-D sequence to... 더 읽어보기 >>
MATLAB image display – grayscale and binary images
In my previous posts (February 9, February 22, and February 29), I discussed the truecolor and indexed image display models in MATLAB, as well as the direct and scaled variations of indexed display. The Image Processing Toolbox has conventions for two additional image display models: grayscale and binary. These conventions are used by the MATLAB image display function imshow, which originated in the Image Processing Toolbox.... 더 읽어보기 >>
- 범주:
- Pixel colors
Divergent colormaps 4
I promised earlier to post about divergent colormaps. A divergent colormap is usually constructed by concatenating two colormaps together that have different color schemes.Here is an example of a... 더 읽어보기 >>
- 범주:
- Colormap
Color Thresholder App in R2014a 7

I had way too much fun this morning playing with the new Color Thresholder app (new in R2014a) in the Image Processing Toolbox, so I wanted to show it to you. I've shown that picture... 더 읽어보기 >>
Automating the extraction of real data from an image of the data – part 2
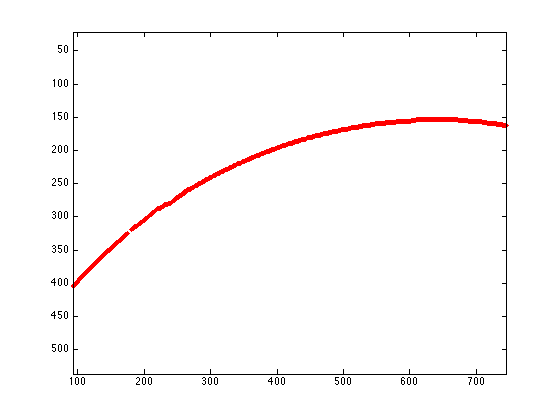
I'd like to welcome back my fellow MATLAB Central blogger Brett Shoelson for the second in a three-part series on extracting curve values from a plot. You can find Brett over at the File Exchange Pick of the Week blog, or you can check out his many File Exchange contributions. -Steve... 더 읽어보기 >>