
MATLAB Benchmark Code for WiDS Datathon 2021
Introduction
Hello all, I am Neha Goel, Technical Lead for AI/Data Science competitions on the MathWorks Student Competition team. MathWorks is excited to support WiDS Datathon 2021 by providing complimentary MATLAB Licenses, tutorials, and getting started resources to each participant.
To request your complimentary license, go to the MathWorks site, click the “Request Software” button, and fill out the software request form. You will get your license within 72 business hours.
The WiDS Datathon 2021 focuses on patient health through data from MIT’s GOSSIS (Global Open Source Severity of Illness Score) initiative. Brought to you by the Global WiDS team, the West Big Data Innovation Hub, and the WiDS Datathon Committee, open until March 1st, 2021. Learn more about the WiDS Datathon, or register to participate today.
The Datathon task is to train a model that takes as input the patient record data and outputs a prediction of how likely it is that the patient have been diagnosed with a certain type of diabetes which could inform treatment in the ICU. In this blog post I will walk through basic starter code workflow in MATLAB. Additional resources for other training methods are linked at the bottom of the blog post.
Load & Prepare Data
This dataset presents an opportunity to learn about the data modelling and processing challenges a real-world data problem brings. In this blog, I will talk about some basic methods to handle data challenges. To learn some more methods you can go through this Data Science Tutorial video series .
Step 1: Load Data
Register for the competition and download the data files from Kaggle. “TrainingWiDS2021.csv” is the training data file and “UnlabeledWiDS2021.csv” is the test data.
Once you download the files, make sure that the files are in the MATLAB path. Here I use the readtable function to read the files and store it as tables. TreatAsEmpty is the placeholder text to treat empty values to numeric columns in file. Table elements corresponding to characters ‘NA’ will be set as ‘NaN’ when imported. You can also import data using the MATLAB Import tool.
TrainSet = readtable('TrainingWiDS2021.csv','TreatAsEmpty','NA');
Step 2: Clean Data
The biggest challenge with this dataset is that the data is messy. 180 predictor columns, 130157 observations with lot of missing values. Data transformation and modelling will be the key area to work on to avoid overfitting the problem.
Using the summary function, I analyzed the types of the predictors, the min, max, median values and number of missing values for each predictor column. This helped me derive relevant assumptions to clean the data.
summary(TrainSet);

There are many different approaches to work with the missing values and predictor selection. We will go through one of the basic approaches in this blog. You can also refer to this document to learn about other methods : Clean Messy and Missing Data.
Note: This approach of data cleaning demonstrated is chosen arbitrarily to cut down number of predictor columns.
Remove the character columns of the table
The reason behind this is that the algorithm I chose to train the model is fitclinear and it only allows numeric matrix as the input arguments. Hence removing variables of “Categorical” or “non-numeric” type.
TrainSet = removevars(TrainSet, {'ethnicity','gender','hospital_admit_source','icu_admit_source',...
'icu_stay_type','icu_type'});
Remove minimum values from all the vitals predictors
After analyzing the DataDictionaryWiDS2021.csv file provided with the Kaggle data, I noticed that the even columns from column 40 to 166 correspond to minimum values of predictors in the vital category.
TrainSet = removevars(TrainSet,(40:2:166));
Remove the observations which have 30 or more missing predictors
The other assumption I made is the observations (patients) which have 30 or more missing predictor values can be removed.
TrainSet = rmmissing(TrainSet,1,'MinNumMissing',30);
Remove the observations which have 30 or more missing predictors
The other assumption I made is the observations (patients) which have 30 or more missing predictor values can be removed.
TrainSet = rmmissing(TrainSet,1,'MinNumMissing',30);
Fill the missing values
The next step is to fill in all the NaN values. One approach is to use the fillmissing function to fill data using linear interpolation. Other approaches include replacing NaN values with mean or median values and removing the outliers using the CurveFitting app.
TrainSet = convertvars(TrainSet,@iscategorical,'double');
TrainSet = fillmissing(TrainSet,'linear');
In this step I move our label predictor diabetes_mellitus to the last column of the table because for some algorithms in MATLAB and in Classification learner app the last column is the default response variable.
TrainSet = movevars(TrainSet,'diabetes_mellitus','After',110);
Step 3: Create Training Data
Once I have the cleaned training data. I separate the label predictor diabetes_mellitus from the training set and create two separate tables XTrain: Predictor data , YTrain: Class labels
XTrain = removevars(TrainSet,{'diabetes_mellitus'});
YTrain = TrainSet.diabetes_mellitus;
Step 4: Create Test Data
Download the UnlabeledWiDS2021.csv file from Kaggle. Read the file using the readtable function to store it as a table. You can also use Import tool to load the data.
XTest = readtable('UnlabeledWiDS2021.csv','TreatAsEmpty','NA');
I used a similar approach for cleaning test data as the training data above. XTest is the test data with no label predictor.
Remove the character columns of the table
XTest = removevars(XTest, {'ethnicity','gender','hospital_admit_source',...
'icu_admit_source','icu_stay_type','icu_type'});
Remove minimum values from all the vitals predictors
The minimum values of vital category correspond to the even columns from column 40 to 166.
XTest = removevars(XTest, (40:2:166));
Fill the missing values
XTest = convertvars(XTest,@iscategorical,'double');
XTest = fillmissing(XTest,'linear');
Step 5: Train a Model
In MATLAB you can train a model using two different methods.
- Using custom MATLAB machine learning algorithm functions
- Training the model using Classification learner app.
Here I walkthrough steps for doing both the methods. I would encourage to try both the approaches and train the model using different algorithms and parameters. It will help in optimization and comparing different model’s scores.
Option 1: Using custom algorithms
A Binary classification problem can be approached using various algorithms like Decision tress, svm and logistic regression. Here I train using fitclinear classification model. It trains the linear binary classification models with high dimensional predictor data.
Convert the table to a numeric matrix because fitclinear function takes only numeric matrix as an input argument.
XTrainMat = table2array(XTrain);
XTestMat = table2array(XTest);
Fit the model
The name value pair input arguments within the function gives the options of tuning the model. Here I use solver as sparsa (Sparse Reconstruction by Separable Approximation), which has default lasso regularization. To optimize the model, I do some Hyperparameter Optimization.
‘OptimizeHyperparameters’ as ‘auto’ uses {lambda, learner} and acquisition function name lets you modify the behavior when the function is overexploiting an area per second.
You can further cross validate the data within input arguments using cross-validation options: crossval, KFold, CVPartition etc. Check out the fitclinear document to know about input arguments.
Mdl = fitclinear(XTrainMat,YTrain,'ObservationsIn','rows','Solver','sparsa',...
'OptimizeHyperparameters','auto','HyperparameterOptimizationOptions',...
struct('AcquisitionFunctionName','expected-improve
ment-plus'));


Predict on the Test Set
Once we have your model ready, you can perform predictions on your test set using predict function. It takes as input the fitted model and Test data with similar predictors as training data. The output is the predicted labels and scores.
[label,scores] = predict(Mdl,XTestMat);
Option 2: Using Classification Learner App
Second method of training the model is by using the Classification Learner app. It lets you interactively train, validate and tune classification model. Let’s see the steps to work with it.
- On the Apps tab, in the Machine Learning group, click Classification Learner.
- Click New Session and select data (TrainSet) from the workspace. Specify the response variable (diabetes_mellitus).
- Select the validation method to avoid overfitting. You can either choose holdout validation or cross-validation selecting the no of k-folds.
- On the Classification Learner tab, in the Model Type section, select the algorithm to be trained e.g. logistic regression, All svm, All Quick-to-train.
- You can also try transforming features by enabling PCA to reduce dimensionality.
- The model can further be improved by changing parameter setting in the Advanced dialog box.
- Once all required options are selected, click Train.
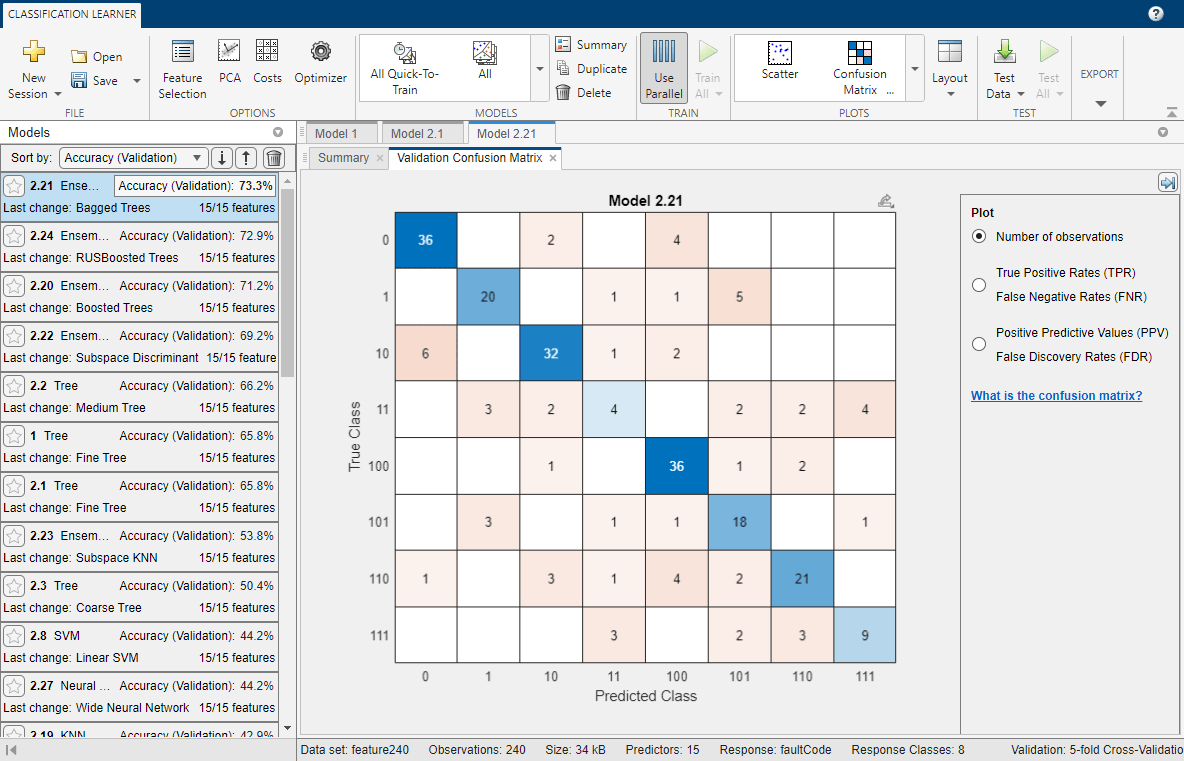
- The history window on the left displays the different models trained and their accuracy.
- Performance of the model on the validation data can be evaluated by Confusion Matrix and ROC Curve sections.
- To make predictions on the test set I export the model by selecting Export Model on Classification Learner tab.

ROC Curve of validation data, exported from Classification Learner App, with Median Gaussian SVM model

Predict on the Test Set
Exported model is saved as trainedModel in the workspace. You can then predict labels and scores using predictFcn.
The label is the predicted labels on Test set. Scores are the scores of each observation for both positive and negative class.
[label,scores] = trainedModel.predictFcn(XTest);
Submit & Evaluate
Step 6: Kaggle Submission
Create a table of the results based on the IDs and prediction scores. The desired file format for submission is:
encounter_id, diabetes_mellitus
You can place all the test results in a MATLAB table, which makes it easy to visualize and to write to the desired file format. I stored the positive labels (second column) of the scores.
testResults = table(XTest.encounter_id,scores(:,2),'VariableNames',...{'encounter_id','diabetes_mellitus'});
Write the results to a CSV file. This is the file you will submit for the challenge.
writetable(testResults,'testResults.csv');
Step 7: Evaluate
Submissions for the Kaggle leaderboard will be evaluated on the Area under the Receiver Operating Characteristic (ROC) curve between the predicted and the observed target (diabetes_mellitus). Submit your testResults.csv file generated above on Kaggle to view your AUC score for the test dataset.
The AUC (Area Under Curve) is the area enclosed by the ROC curve. A perfect classifier has AUC = 1 and a completely random classifier has AUC = 0.5. Usually, your model will score somewhere in between the range of possible AUC values is [0, 1].
Confusion matrix plot is used to understand how the currently selected classifier performed in each class. To view the confusion matrix after training a model, you can use the MTALAB plotconfusion function.
To perform evaluation model, MATLAB has perfcurve function. It calculates the false positive, true positive, threshold and auc score. The input arguments to the function include test labels, scores and the positive class label.
For your self-evaluation purpose you can create the test label (YTest) by partitioning a subset from training set and use the scores generated from the trainedModel.
Note: the auc calculated through this function might differ from the auc calculated on Kaggle leaderboard.
[fpr,tpr,thr,auc] = perfcurve(YTest,scores(:,2),'1');
Thanks for following along with this code! We are excited to find out how you will modify this starter code and make it yours. I strongly recommend looking at our Resources section below for more ideas on how you can improve our benchmark model.
Feel free to reach out to us in the Kaggle forum or email us at studentcompetitions@mathworks.com if you have any further questions.
Additional Resources
- 범주:
- Data Science,
- MATLAB


댓글
댓글을 남기려면 링크 를 클릭하여 MathWorks 계정에 로그인하거나 계정을 새로 만드십시오.