Ken & Mike on the MATLAB Desktop
May 12th, 2008
Brush up on your data
We’ve already received great feedback on Data Brushing, a new MATLAB R2008a feature that is closely related to Data Linking.
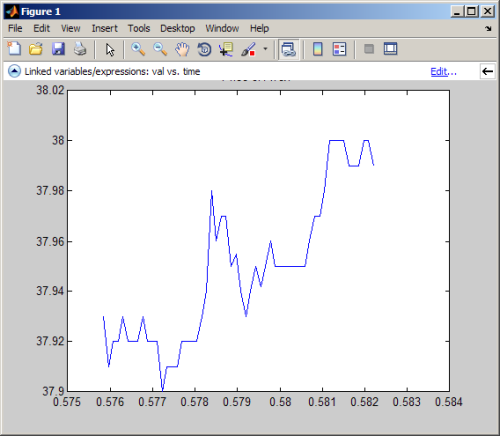
Data Brushing allows you to graphically edit the data in a plot, allowing you to clean up the data, or focus in on a particular region. Unlike Plot Tools, which allow you to edit the graphics of the plot (labels, legend, colors, etc), this feature works on the actual data in the plot.
Here I’ve taken the L-shaped membrane (MathWorks logo) and brushed the flat part. I changed the color of the brushing from the default red to hot pink for better contrast (The color can be changed by clicking the drop-down button next to the brush icon).
Right-clicking the brushed area gives options to delete the data (for cleaning up outliers), replacing the data with a new value, or various copy options. Here’s what happens if I replace the flat area with NaN’s:
You can also drag the highlighted region into Microsoft Excel or a text editor and it will give you a table of the highlighted data.
As a bonus, if you have data linking turned on, the changes are reflected back in the workspace. If you haven’t already watched the tutorial video, I suggest you take a look at it.
By combining brushing with linking, you get a nice tool for data exploration and data manipulation that allows you to work in one domain, when the data you care about is visualized in another domain. Two great uses come to mind: filter design and principal component anaylsis–basically anytime you want to look at the same data in multiple ways at the same time. The above linked video shows this with highway safety data.
These tools give a lot of flexibility and ease of manipulating graphs. Please exercise responsible presenting.
By
Michael Katz
Mike is a developer on the MATLAB Desktop team. When not describing himself in the third person, biking, homebrewing, or rooting for the home team, he's busy trying to make the world a better place for programming.
05:44 UTC |
Posted in Data Tools |
Permalink |
You can follow any responses to this entry through the RSS 2.0 feed.
You can skip to the end and leave a response. Pinging is currently not allowed.
Leave a Reply
|
Great post Michael! I’ve loved all of the introductions to data-linking and data-brushing; I know the functionality is old news now… but it’s new to me!
I’m having an issue with the datalinking, and I wanted to pick your brain about it. I am attempting to link the data for multiple histograms in a figure without using the datalinking gui provided (I would like to have all of the datalinking performed in a matlab function / m-file). If any advice can be shared, it would be greatly appreciated. Datalinking and databrushing are incredible features, but my understanding of their inner workins is seriously lacking.
To the best of my knowledge, histograms do not have a YDataSource property available (in the get/set property interface). I have occasionally succeeded in setting the ‘DisplayName’ property to the desired data string (such as ‘plotdata(:,3)’), but this generally does not work.
I am aware that for normal plots, the following will work:
handle = plot(plotdata(:,1),plotdata(:,2),... 'XDataSource','plotdata(:,1)',... 'YDataSource','plotdata(:,2)');However similar attempts do not work for histograms.
Thanks in advance for your help!
Spencer,
hist has special handling that allows it to be brushed, as described in the documentation.
I like this tool very much. But I think there is a bug when “Create Variable” with the burshed data. When the burshed data number is large (e.g >2000), if the created variable is not cleared from the workspace before you use “Create Variable” to create a variable with the same name MATLAB will loss focus and I have to restart MATLAB to make it work again.
junziyang,
What version of MATLAB are you using? On what platform? What do you mean by “loose focus”?
MATLAB R2009a
Windows Vista 32bit Home Premium
MATLAB is minimized when the problem happens. After that you can not interact with it any more, such as edit code, or want to click a toolbar icon, even the maximize/minimize/close buttons. You have to close MATLAB from the task manager and restart it again.