Skip to Main Content Skip to Search
File Exchange
MATLAB Newsgroup
Link Exchange
  Blogs  
 Contest 
MathWorks.com

Steve on Image Processing

August 21st, 2007

Gray scale pixel values in labeled regions

The functions bwlabel and regionprops are very useful for measuring the properties of shapes in a binary image. There are documentation examples and product demos showing how to do this, and I've shown these functions in action several times in this blog.

But sometimes I get questions about how to process pixel values in the "original" gray scale image. In other words, suppose your process is something like this:

  • Segment gray scale image to get a binary image of objects
  • Label the binary image objects using bwlabel
  • Do something with the original gray scale pixel values corresponding to each labeled object

This post is about how to do that last step. Let's start by creating some simple sample images to work with.

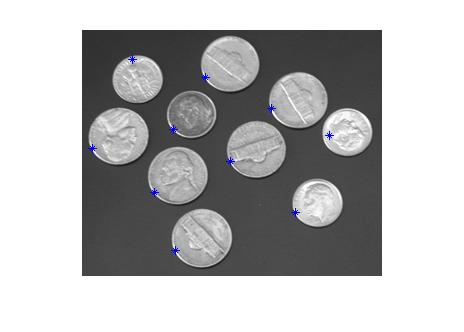
I = imread('coins.png');
imshow(I)
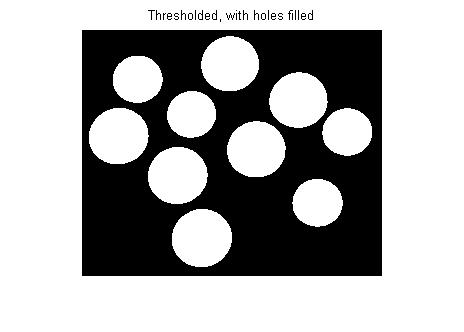
bw = im2bw(I, graythresh(I));
bw = imfill(bw, 'holes');
imshow(bw)
title('Thresholded, with holes filled')
L = bwlabel(bw);
imshow(label2rgb(L, @jet, [.7 .7 .7]))
title('Label matrix')

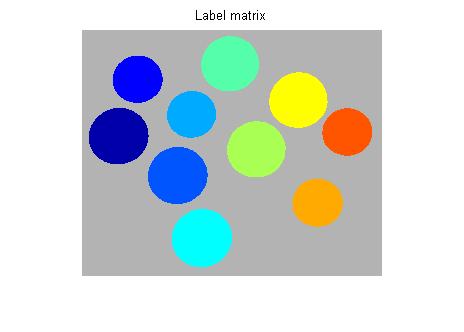
The key for using L to process the pixels in I is to use regionprops to get the 'PixelIdxList' for each labeled region.

s = regionprops(L, 'PixelIdxList')
s = 

10x1 struct array with fields:
    PixelIdxList

s is a struct array. s(k).PixelIdxList is a vector of the linear indices of the k-th region. You can use these values to index directly into I. For example, here is the mean pixel value of the 3rd coin:

idx = s(3).PixelIdxList;
mean(I(idx))
ans =

  172.8769

You can also replace object pixel values in I by indexing on the left side of an assignment statement, like this:

% Turn the 4th coin white and the 5th coin black:
J = I;
J(s(4).PixelIdxList) = 255;
J(s(5).PixelIdxList) = 0;
imshow(J)

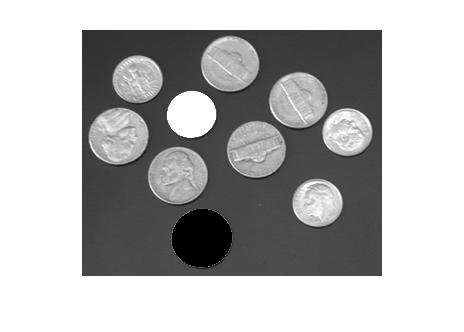
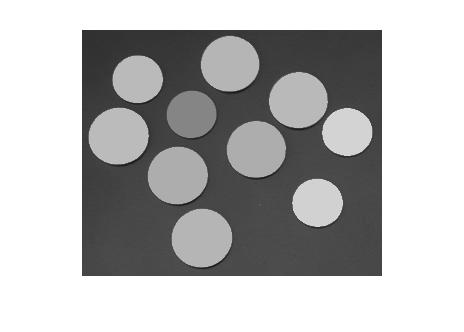
Here's a loop that replaces the pixel values for each coin by the mean pixel value for that coin:

F = I;
for k = 1:numel(s)
    idx = s(k).PixelIdxList;
    F(idx) = mean(I(idx));
end
imshow(F)

I'll finish with a question that Mat asked in a blog comment: "How can I find the location of the maximum pixel value in each labeled region?" Here's how to find the locations and then plot them on top of the original image. (In addition to 'PixelIdxList', I'll also ask regionprops for 'PixelList', which gives the x and y coordinates of each pixel in the region.)

s = regionprops(L, 'PixelIdxList', 'PixelList');
imshow(I)
hold on
for k = 1:numel(s)
    idx = s(k).PixelIdxList;
    pixels_in_region_k = I(idx);
    [max_value, max_idx] = max(pixels_in_region_k);
    max_location = s(k).PixelList(max_idx, :);
    plot(max_location(1), max_location(2), '*')
end
hold off


Get the MATLAB code

Published with MATLAB® 7.4

39 Responses to “Gray scale pixel values in labeled regions”

  1. Martin Berger replied on :

    Hi Steve!
    I am looking for an efficient solution to relabel an already existing label image. My problem is, that I start with a valid label image (e.g. returned from bwlabel) and then I do some modifications where some already labeled regions split, some labeled regions are removed. Thus, I am destroying the label image structure, e.g. after removing the region with ID = i I do not have any label i in my label image anymore. How do I regain a valid label structure from the modified image in the most efficient way (without loops)?
    Thx, Martin

  2. Steve replied on :

    Martin—That’s a great question, worthy of another post. I recall having to “relabel” a label matrix before, but I don’t remember exactly why. Before I work up something in detail, though, can you say more specifically what output you are looking for? From your description, I imagine you have bw and a corresponding L, and you have a modified bw in which some original regions are split and some removed. Are you looking for a mapping from the label values for the modified bw back to the original label values?

  3. Martin Berger replied on :

    Steven, in my special case I do not have the corresponding bw image anymore. I have a label image (representing a segmentation result of a color image) and I do some post-processing as e.g. removing the smaller regions, which destroys the label structure (as e.g. a split). And now I just want to repair the label structure to be valid again (meaning no missing ids and not having two unconnected regions with the same id - somehow a labeling of a label image)
    thx
    Martin

  4. Steve replied on :

    Martin—It sounds like calling bwlabel on the modified label matrix would satisfy your requirements.

    L2 = bwlabel(modified_L ~= 0);
    
  5. Daphne replied on :

    Hi Steve,
    Is there a way to find, for example, the intensity weighted centroid of each of the labeled regions, and not just the location of the brightest spot ?
    What about only finding the centroids of regions where the brigtest spot is over a certain threshold?
    Thanks,
    dpahne

  6. Martin Berger replied on :

    Steve,
    L2 = bwlabel(modified_L ~= 0) will not work because in the step: modified_L ~= 0 -> neigbouring regions with different labels > 0 will be merged.
    Martin

  7. Bob replied on :

    Hi Steve,

    This is great! been looking for similar items for ages…

    I wonder if you would be able to solve a similar problem to Martins for me…

    I have a set of 3d slices each with individual labels/slice. However I need to be able to match different labels between slices…. For instance currently blob 1 in slie 1 maybe labelled as blob 2 in slice 2 etc… How can I recompute all these around, so that I am not missing labelled items and the blobs are accounted for vertically.

    I can post you some images if that helps.

    Thanks so much, I’ve been stumped by an easy way to do this for ages!

    Bob

  8. Steve replied on :

    Daphne—Yes, there’s a good way to find the intensity-weighted centroid. I’ll write a blog post about it in a few days. Can you say a little more about how you want to use this calculation? What is your scenario?

    Your second question is also worth a follow-up post.

    Thanks!

  9. Steve replied on :

    Martin—I’m not being dense on purpose :-) but I’m still having difficulty interpreting your problem description. Would you please send me a small example of an L, a modified L, and what your desired output would be?

  10. Steve replied on :

    Bob—I believe I can help with that, and it might be worth a follow-up post. Would you please send me a couple of representative slices? And let me know if I have permission to use them in a blog post.

  11. Daphne replied on :

    Hi Steve,
    Thanks!
    My uses are for tracking fluorescent particles, in real time inside living cells. Basically, round-ish (pretty pixelated) bright spots on a dark background.
    Localizing the intensity-weighted centroid allows us to get sub-pixel resolution and effectively use the microscope under the resolution limit of light.

    Having the option to pick only blobs > a threshold allows us to remove any unfocused particles. We filter out noises before-hand.

    I’m currently using my own code, which I wrote when I had no access to any of the toolboxes, and am curious to see how much this can be improved. Since we use this to analyze entire movies, frame-by-frame, any unnecessary slowdown is painful.

    Thanks again,
    Daphne

  12. Steve replied on :

    Daphne—Thanks for the additional information, Daphne. When we hear feature requests, we try to make sure we understand the complete use case. That helps us prioritize our work and make sure that it really satisfies the real user need.

  13. Patrick replied on :

    Hi Steve,
    I’m working on rendering images of 3D models in Matlab. My immediate question is: can I use getframe (or any other built-in function) to grab an image without the figure ever being visible? Basically what I have been doing is rendering my model using fill3 and surf commands, to an invisible figure. I’m doing this inside nested ‘for’ loops to generate lots of candidate images, then computing some stats on the images, and once the whole program is working I won’t ever want to see the 1000’s of candidates, just the eventual winner. But the call to getframe always makes a figure pop up as each candidate image is captured. Is there a way to circumvent this?

    Thanks!
    Patrick

  14. Steve replied on :

    Patrick—You can use the print function with invisible figures. This tech support solution shows how.

  15. Walid replied on :

    Hi Steve,
    I wont to fin the meighbor region in my labled image. do you have an idea about how to do it?
    Thanks.
    Walid

  16. Steve replied on :

    Walid—This contribution on the MATLAB Central File Exchange might be useful.

  17. Sven replied on :

    Hi Steve,
    To perhaps add to some questions from earlier comments about re-labeling blobs:
    Imaging a case where you label your binary image then find that you want to remove blobs 5, 8 and 11.
    L = bwlabel(I);
    L(ismember(L,[5 8 11])) = 0;

    For your next function downstream, you want to have your labels run continually from 1 to (number of blobs), without skipping 5, 8 and 11. Of course, you could just rerun bwlabel with { L = bwlabel(L>0); }. *However*, this duplicates the effort of separating blobs which has already been done by the first call to bwlabel. When dealing with big matrices (I am using bwlabeln on some 3D voxel spaces), this is inefficient.

    Do you have any smart little tricks to ‘relabel’ without recomputing connectivity? My guess is a loop over the unique elements of L…
    Cheers,
    Sven.

  18. Steve replied on :

    Sven—I’ll try to write something up about this soon.

  19. Sven replied on :

    Cheers Steve.
    My initial solution is below. I found it works just fine for 2d cases. It was surprisingly slow however for a 3d case. In my particular application I don’t have any blobs connected along the 3rd dimension, so I found that nesting the code below in a loop over the 3rd dimension to work quickest.

    current_blob_id = 0;
    for found_blob_id = unique(L(L>0))’
    current_blob_id = current_blob_id+1;
    L(L==found_blob_id) = current_blob_id;
    end

  20. Steve replied on :

    Sven—Use regionprops to get the PixelIdxList for each labeled object, and then use linear indexing to reassign labels as you desire. I expect that will be a lot faster than what you’re doing now.

  21. Sven replied on :

    Thanks Steve, much faster and simpler! It’s almost as if you have the inside scoop on these functions ;)

  22. Siam replied on :

    Hi Steve,

    How do you label the regions of imbedded structures?. For example three squares of decreasing size imbedded inside each other in sequential order. Another example would be three concentric circles.

    Since the image is connected and there is no background level separating the circles, I’m doubting that binary labeling would would work.

    Thanks in advance,

  23. mathan replied on :

    hi. I would like to know how to relabel an image. The normal bwlabel function label an image (1 to L) from left coloumn to right coloumn. I need to label it from top to bottom, left to right of an image so that those segmented images can extrated according to an order.

  24. Steve replied on :

    Siam—Look up “flat-zones labeling” algorithms. Although there’s nothing in the Image Processing Toolbox for this yet, some of the algorithm development techniques I’ve described in this blog could be used to implement something like that.

  25. Steve replied on :

    Mathan—You can post-process the labels to sort them in whatever order you wish. For example, use regionprops to get the ‘BoundingBox’ of each labeled object, and then use sortrows to sort first on y and then on x.

  26. Regina replied on :

    I have a microarray image with defined spot boundary for each spot. Is there any way to get the pixel intensities for each spot within a spot boundary? I mean, do you know how to get pixel intensities that are not only bw? Thank you very much!!

  27. Bob replied on :

    @Regina, FYI - there is a microarray submission on the MATLAB File Exchange that does region based spot intensity measurement.

    Cheers
    Bob

  28. James replied on :

    hi Steve~
    I have some problems with the code.
    I enter the code you provided but appeals an error on

    Error in ==> bwlabel at 48
    iptcheckinput(BW, {’logical’ ‘numeric’}, {’real’, ‘2d’, ‘nonsparse’}, …

    Error in ==> SteveEddins at 38
    L = bwlabel(I);

    I have no idea how to solve it. Could you help me with it?
    Actually, your code can deal with many objects in one picture. But i only need to measure one object centroid in
    one picture. So is there any way to get to it?

  29. Mikle Norton replied on :

    I have a similar question to the one left by Daphne, again having to do with determining the subpixel location of the center of a gaussian point spread function of the imaging system. Essentially finding the center of a subwavelength diameter sphere.

    However, what would be of use to us would be having this ability “live” during the point designation process in image alignment in the image processing toolbox.

    This would make something called 2 color FIONA (fluorescence imaging at one nanometer accuracy) easier.

    Must admit, this site is not on my frequent views listing, so an email hint to hit the link would be great,

    Thanks,

    Mike

  30. Mike Norton replied on :

    I’m hoping to get something like 1 percent pixel resolution ie center of gaussian determined to .01 pixel level

  31. Mike Norton replied on :

    The blog system erases old posts ?

    My question is similar to Daphne’s and different

    We are implementing 2 color FIONA ( fluorescence imaging at one nanometer accuracy) and it would be helpful to designate control and object points with subpixel resolution using a gaussian point spread function ( or gaussian fit) in order to set up the cp2tform for image registration.

    I’m hoping to get something like 1 percent pixel resolution ie center of gaussian determined to .01 pixel level

  32. Steve replied on :

    Mike,

    The system does not erase old comments. All comments are held for moderation, meaning that I have to see and approve them before they appear.

    You might try computing the region centroid, weighted by the point-spread function values. See this post. In R2008a, the regionprops function can compute this measurement. I don’t know about getting 1% accuracy, though. That may be expecting too much.

    To get e-mail notification of new content on this blog, click on the “Posts (e-mail)” link under my picture on the right side of the page.

  33. Steve replied on :

    James—The code I provided does not contain the line:

    L = bwlabel(I);
    

    You need to check your work. Or try clicking on the “Get the MATLAB code” link at the bottom of the post.

    To select just one object in a binary image, try using bwselect.

  34. Xavier replied on :

    Steve,
    I am interested in getting the statistics of each grayscale blob, such as its mean, minimum value, maximum value, and a distribution of the pixel values. Is it possible to do that with regionprops? An example would be very helpful. Thanks much.

  35. Steve replied on :

    Xavier—Doesn’t this post help you? It includes code showing how to compute the mean value. You can use this code with minor modifications to compute the other things you mentioned. If you have the R2008a release, regionprops supports the min, max, and mean value measurements.

  36. shawkat m. replied on :

    hi stev
    i want to know how can i find the cross_sectional area
    for each labled coin

  37. Steve replied on :

    Shawkat—I’m not sure exactly what you mean by “cross-sectional area” of a coin, but regionprops might do what you want.

  38. shawkat m. replied on :

    hi steve
    i mean by The cross-sectional area of each coin and the average area the total number of pixels in each coin

  39. Steve replied on :

    Shawkat—Use regionprops.

Leave a Reply


Steve Eddins manages the Image & Geospatial development team at The MathWorks and coauthored Digital Image Processing Using MATLAB. He writes here about image processing concepts, algorithm implementations, and MATLAB.

  • Assaf: Hi, I have 3 questions regarding the following sentence: “Rather than using the power spectrum from a...
  • Steve: Cara—I do not understand your question. Can you clarify it?
  • Cara Schiek: Hi. How could I do this same thing with image vales within the patches? cara
  • Steve: Vincent—OK, thanks for the information.
  • Vincent: My only data point on multithreading is that the Performance tab of the Task Manager shows increased CPU...
  • Steve: Vincent—Thanks for giving it a try and reporting back. I’m a bit skeptical that multithreading...
  • Vincent: Oops numbers were wrong. Data set was 450MB large so the numbers are: Results: ImageJ alone =< 5 s (or 90...
  • Vincent: Steve- I just had a quick run at the new imread.m patch. It’s much faster than the previous version...
  • Steve: Erik—Also, separability of the kernel provides no speed benefit in FFT-based implementations....
  • Steve: Erik—Good questions. Remember that, practically speaking, when we filter a 2-D signal with a 1-D filter...

These postings are the author's and don't necessarily represent the opinions of The MathWorks.

Related Topics