Reproducing figures
I’m taking a break this week from MATLAB R2010a features to show you a feature that’s been a part of MATLAB for years: generating MATLAB code from a figure. Last week I had the opportunity to visit some of our customers and observe what they do with MATLAB. I was surprised by the amount of effort one person spent on plotting and setting up the figures for series of data. His data sets represented different runs of repeated experiments, and as you can imagine, the figures all looked pretty similar. We suggested that he could save time by writing a function that took in a set of data and created and plot, that way he would only have to write and debug the various commands (such as plot, legend, axis, colormap, etc.) once.
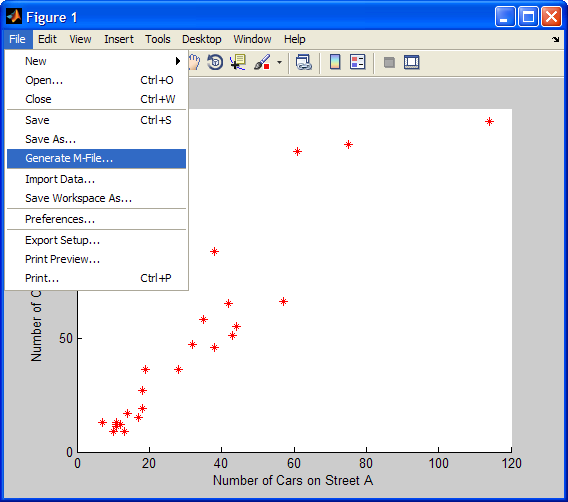
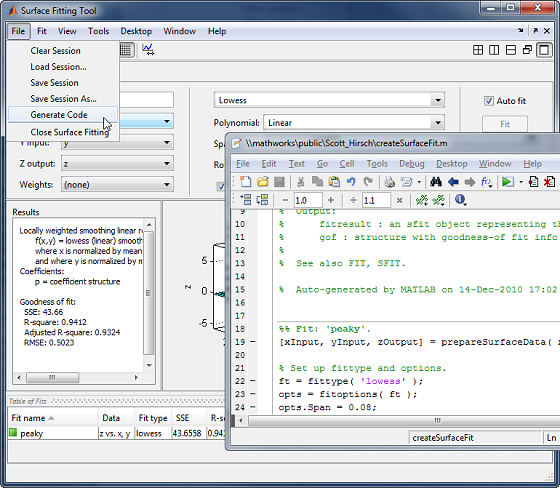
The workflow I suggested to that user is as follows: (A) plot some data, (B) spiffy up the plot from the command line, (C) save those commands to a function file, (D) repeat on additional sets of data. I further suggested that step “C” could be sped up using code generation from the figure. Every figure has a “Generate M-File” command under it’s File menu. This command takes the Handle Graphics objects in the figure and recreates them in a function, where all you have to do is pass in the plot data. What I like about this feature is that the generated function is readable and can teach you about new properties of plot objects.
Here is an example of how it works, using the Scatter Plot from the graf2d demo:
load count.dat
scatter(count(:,1),count(:,2),'r*')
xlabel('Number of Cars on Street A');
ylabel('Number of Cars on Street B');
This code generates the following scatter plot:

From the figure’s “File -> Generate M-File” menu item we get the following function created in the editor:
function createfigure(X1, Y1, S1, C1)
%CREATEFIGURE(X1,Y1,S1,C1)
%  X1:  scatter x
%  Y1:  scatter y
%  S1:  scatter s
%  C1:  scatter c

%  Auto-generated by MATLAB on 16-Apr-2010 11:07:47

% Create figure
figure;

% polar currently does not support code generation, enter 'doc polar' for correct input syntax

% polar(...);

% Create scatter
scatter(X1,Y1,S1,C1,'Marker','*');

% Create xlabel
xlabel('Number of Cars on Street A');

% Create ylabel
ylabel('Number of Cars on Street B');
The quality and re-usefulness of the generated function will depend on the data, as well as the functions used to create the original plot. The generate file command uses low-level objects and basic plot types, so if the original plot was generated by a function that performs a lot of set up or massaging of data, there may be a decent amount of set-up you’ll have to perform in order to use the generated function. For example, in original code from graf2d the plot was performed by the 3-input form of scatter and our generated file uses the 4-input form, whose inputs we have to supply when calling generated createfigure like so:
createfigure(count(:,1),count(:,2),40,'r')
To get back my original plot, I had to intuit what the appropriate inputs need to be. In my simple example, I no longer need to supply the axes labels, but now have to define the marker size (input 3, “40”), and while the marker type, “*,” is taken care of, I still have to tell it “r” (4th input) to make it red. Using a different type of plot could mean that there are fewer things to specify, but they will still likely be different than the original set of inputs.
I hope you can imagine that with a more complicated figure with subplots, multiple titles and legends, etc that this feature could save a bit of work. Sometimes I use this feature in the same way I use GUIDE: I use the interactive mode (Plot Tools) to get the figure how I want it, generate the code, and then copy the appropriate sections to my own hand-written file that is more readable.
- Category:
- Data Tools
 Cleve’s Corner: Cleve Moler on Mathematics and Computing
 The MATLAB Blog
 Guy on Simulink
 MATLAB Community
 Artificial Intelligence
 Developer Zone
 Stuart’s MATLAB Videos
 Behind the Headlines
 File Exchange Pick of the Week
 Hans on IoT
 Student Lounge
 MATLAB ユーザーコミュニティー
 Startups, Accelerators, & Entrepreneurs
 Autonomous Systems
 Quantitative Finance
 MATLAB Graphics and App Building


Comments
To leave a comment, please click here to sign in to your MathWorks Account or create a new one.