Speed Up Your GUIs With Profiling
I bet most of the people that use the MATLAB Profiler run their code through the little “Run This Code” box at the top of the Profiler UI. When you do this the profiling happens only for that one function call, and the data is returned immediately. This is fine for testing a script or function, but when you do this for a GUI function, you will only profile the GUI’s set-up. Unless it takes a long time for it load, this is generally not as useful as profiling the callbacks associated with the GUI.
In order to profile a GUI’s callbacks you need to start the Profiler from the command line before you do the interesting work, using the command:
profile on
Once the profiler is running, you can interact with the GUI to run its callbacks. Then, when you’re ready to stop profiling and view the results, execute the command:
profile viewer
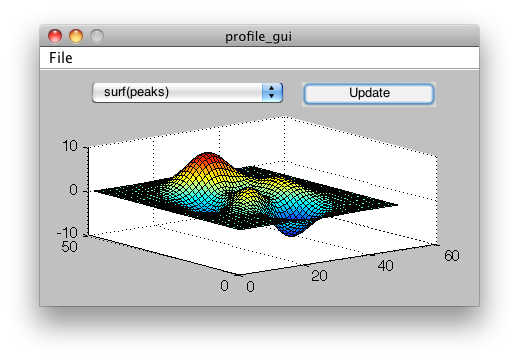
In following example I created a new GUI using GUIDE’s “GUI with Axes and Menu” template.
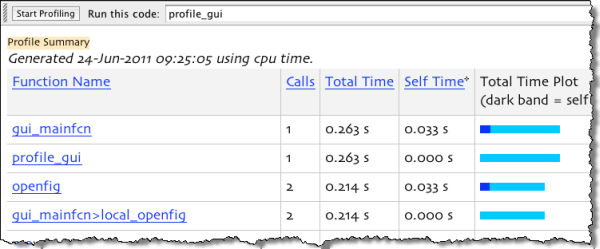
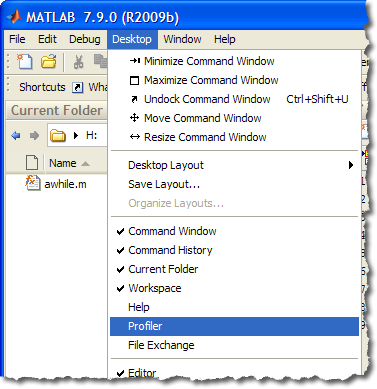
I then opened the Profiler from the Desktop -> Profiler menu. You can see here when I run the “profile_gui” function directly in the Profiler, all the function calls involved in setting up the GUI are listed. In particular at top is the GUIDE’s helper function gui_mainfcn and my function profile_gui.
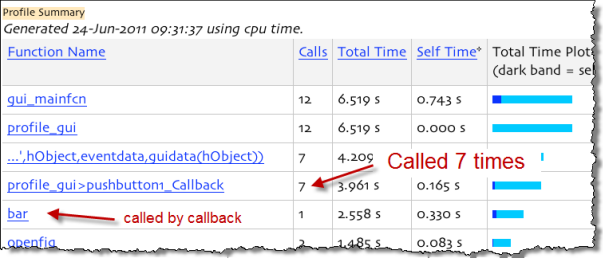
The whole process took about 1/4 seconds, so it’s probably not worth optimizing. Instead, let’s look into what happens when the “Update” button’s callback is run. To do that, I’ve typed “profile on” and then started up the GUI. Then I pressed the button a few times followed by a “profile viewer.” From this view we can see profile_gui and gui_mainfcn again, as well as my pushbutton1_Callback and some of the functions called through the callback. According to the “Calls” column, you can see I pressed the button 7 times. Interestingly, you can see that the main function was called 12 times. This is because a GUIDE GUI calls back into itself for its various callbacks and set-up routines.
From the top Profiler page we can step into the callback function itself. From the time by line chart, we can see that even though it called bar only once, it was the longest command to run. The next longest command was surf but from the Calls column, you can see I ran that one four times.

At the bottom of the Profiler screen, we can take a look at this same information overlaid on top of the code, by looking at the code by time or number of calls. The first screen capture is the code highlighted by the relative amount of time, and the second by relative number calls.
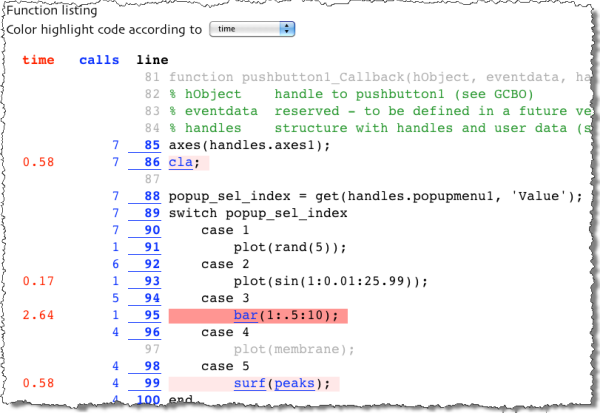
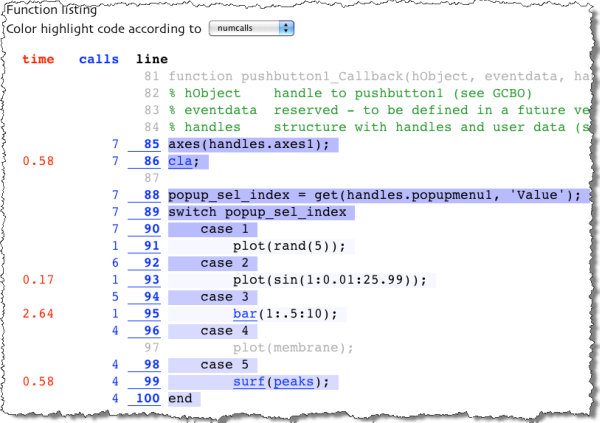
If my code took longer, I would use this information to improve its performance. For example, if turned out that that bar was called many times, I might cache the results (since the data doesn’t change).
- Category:
- Debugging,
- MATLAB GUI,
- Profiler,
- Programming




Comments
To leave a comment, please click here to sign in to your MathWorks Account or create a new one.