
Tips and Tricks when Dealing with Callbacks in Simulink
As you probably know, it is possible to define many types of callbacks in a Simulink model. Callbacks can be very useful to automatically execute MATLAB code in certain situations, for example when a model or block is loaded, opened, initialized, etc.
If you are not familiar with setting up callbacks, I recommend getting started by reading Customize Model Behavior with Callbacks.
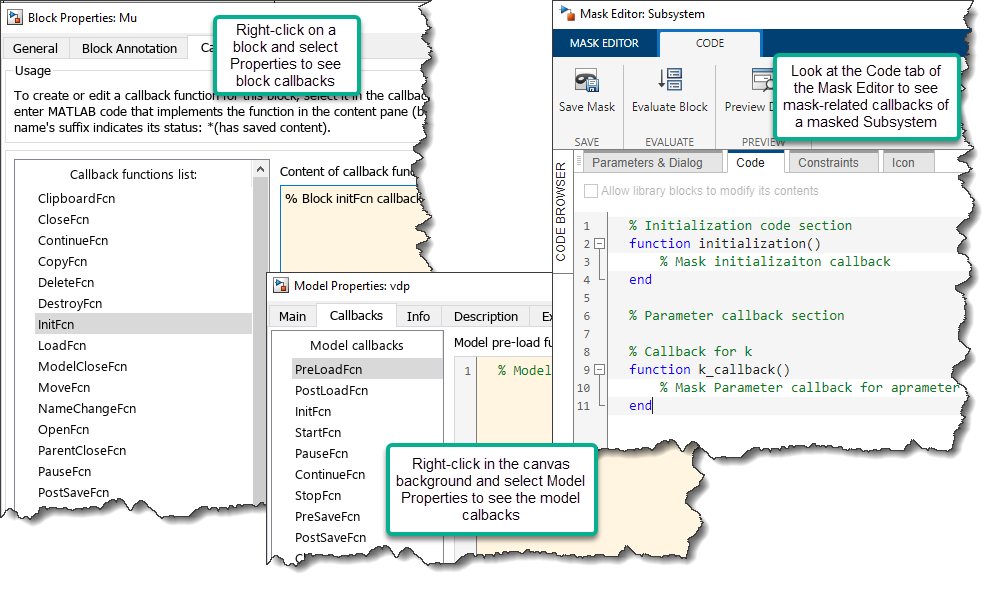
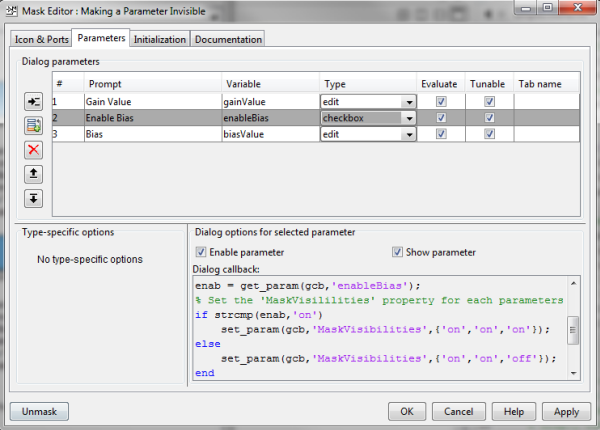
Here is a screenshot with the most common callbacks:
While they can be useful, callbacks can sometimes lead to situations like:
- Something seems to happen "auto-magically" and you would like to understand what triggers it
- Callbacks are executing in an order different than what you were expecting
- Performance issues if a callback takes longer than expected to execute
To help with that, we introduced in MATLAB R2022a the Callback Tracer. Let's see how this new tool can help you.
Logging Callbacks
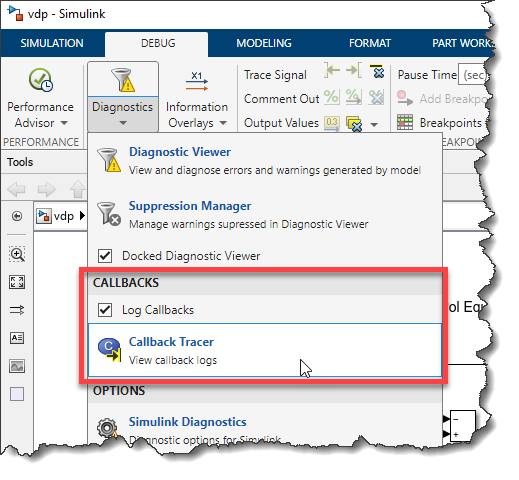
To get started, in the Debug menu, enable the Log Callbacks option and open the Callback Tracer
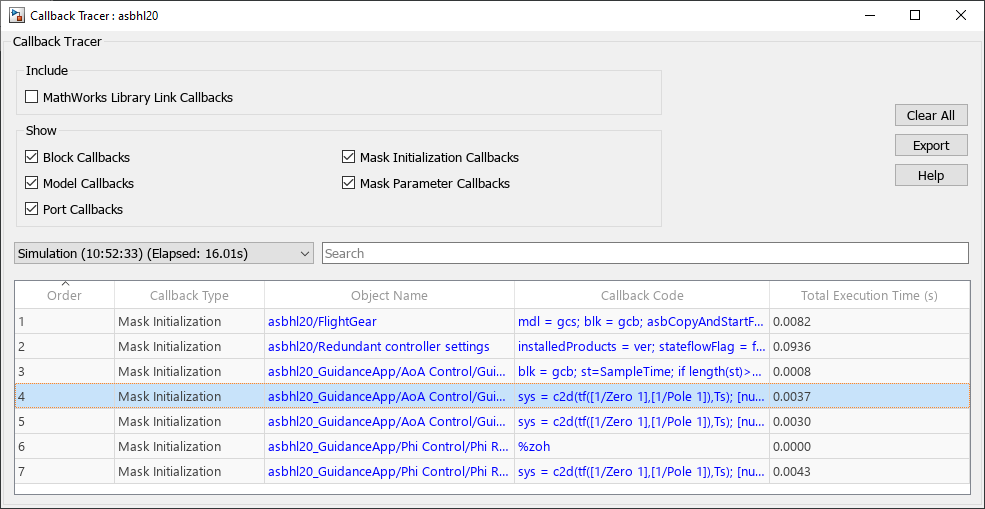
With the Callback Tracer opened, try different actions in your model like simulating or saving it. For each callback, you will see an entry in the Callback Tracer listing which block it comes from and how long it took to execute:
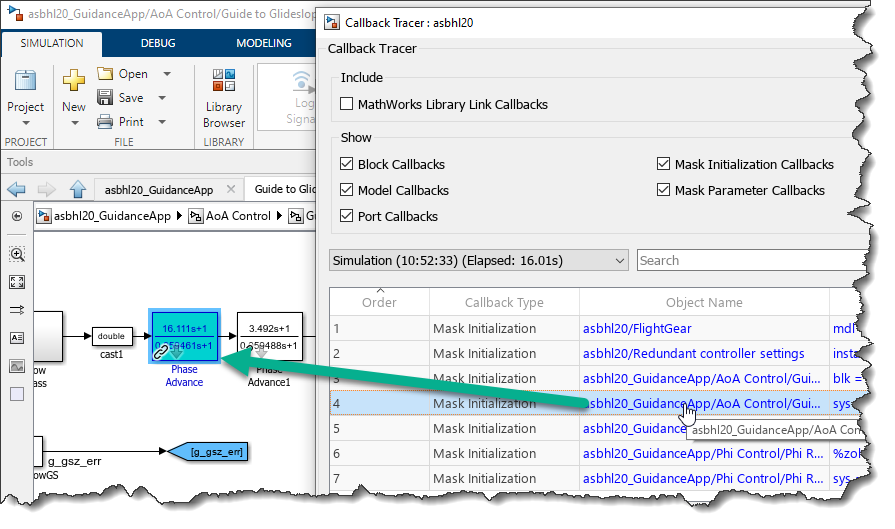
If you want to investigate, click on the Object Name column to highlight the block in the model:
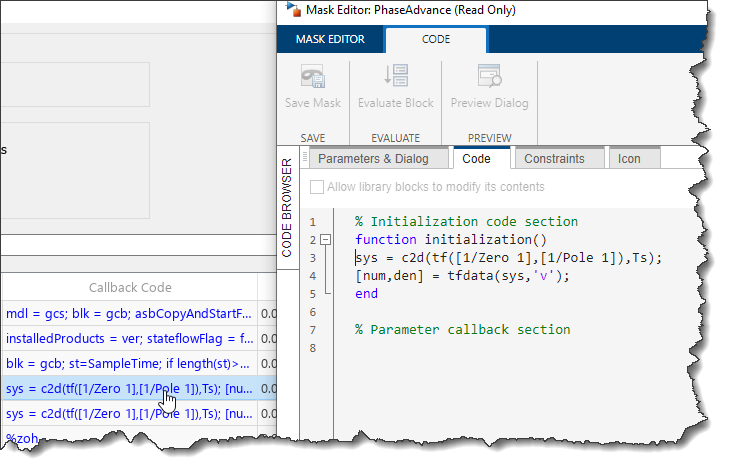
To edit the callback code, click on the Callback Code column. This will open the Mask Editor or the Property dialog where the callback is defined:
It is possible that the Callback Tracer will not answer all your questions, but it should at least point you in the direction of what should be investigated next. Once you have identified where to dig deeper, here are two additional techniques that could help you.
Debugging Callbacks
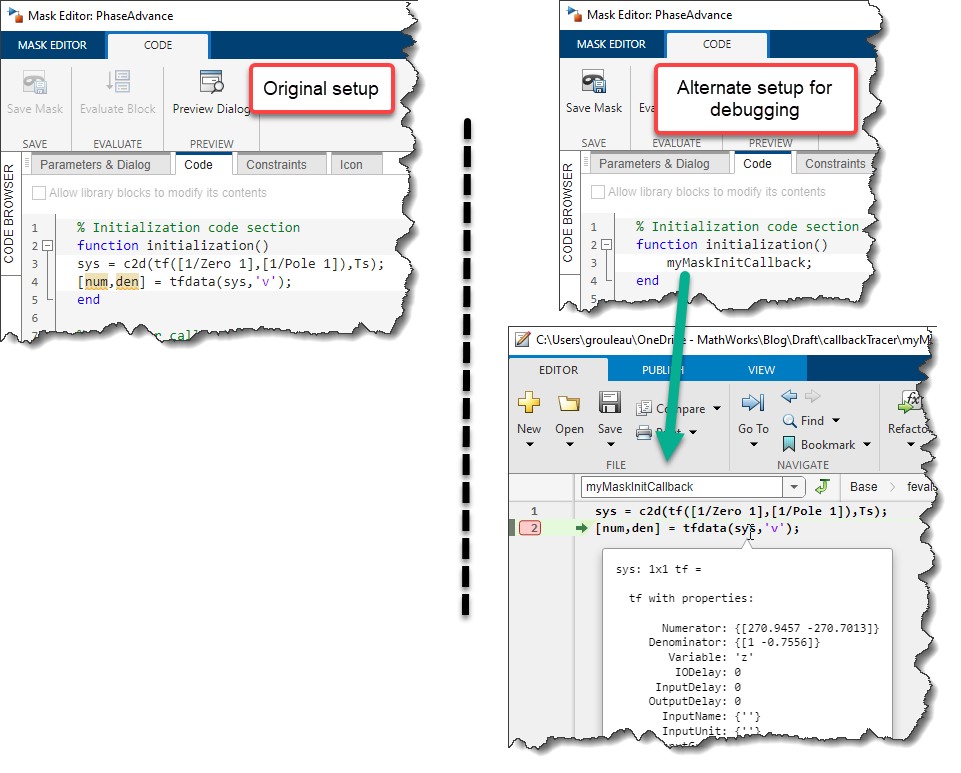
As of MATLAB R2022b, it is not possible to put breakpoints directly in the Properties dialog or the Mask Editor to debug callbacks directly there. If you need to debug callback code, what I recommend is to store it in a MATLAB script or function and call this file in the callback.
With a setup like this one, you will be able to leverage all debugging features of the MATLAB Editor:
Profiling Callbacks
As mentioned above, the Callback Tracer lists the total execution time for each callback, allowing you to quickly identify which callback takes the most time.
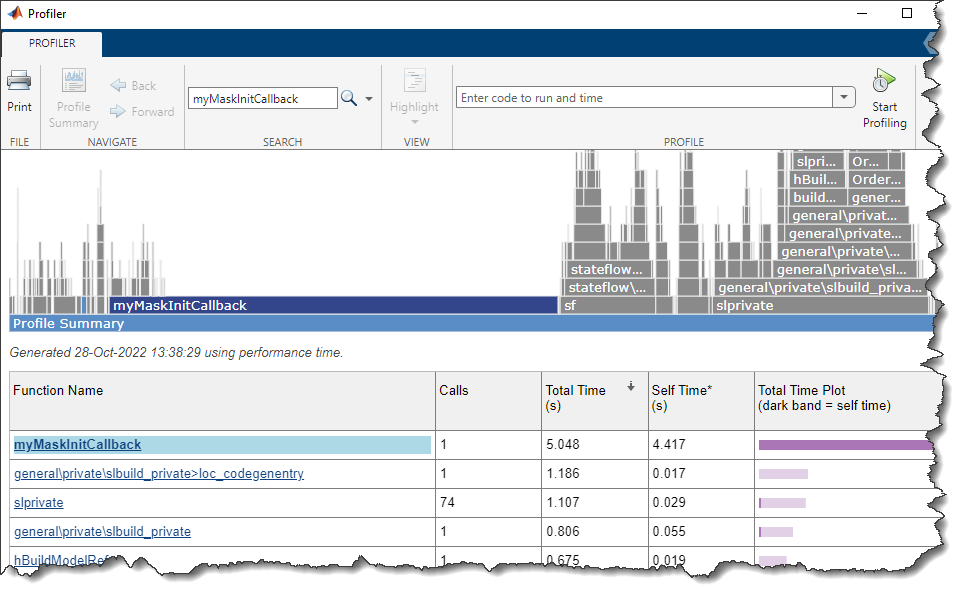
If you want more insights on one specific callback, you can then use the MATLAB Profiler. For example, if I am concerned about a callback triggered during model initialization, I could run code like this:
profile on
set_param(myModel,'SimulationCommand','Update')
profile viewer
Then in the profiler report I can find the callback I am interested in and get more info on its self-time and the other functions it is calling:
Now it's Your Turn
Let us know in the comments below if you have tips or tricks to debug callbacks in Simulink.
- Category:
- Simulink Tips,
- What's new?


Comments
To leave a comment, please click here to sign in to your MathWorks Account or create a new one.