
Climate change will exacerbate income inequality
In the U.S., the effects of climate change will exacerbate income inequality. That’s the conclusion in new research, recently published in Science. The counties in the south, already among the less fortunate economic environments, will suffer more economic damage than the relatively wealthier areas in the Pacific Northwest and New England.

Image Credit: Hsiang, Kopp, Jina, Rising, et al (2017).
According to NPR, “Climate change will redistribute wealth by driving workers, businesses and agriculture away from those hard-hit regions and move them mostly toward the north and west of the country.”
The analysis was produced by the Climate Impact Lab, a consortium of researchers from UC Berkeley, Rutgers, University of Chicago, and Rhodium Group. The study simulates the effects of climate change on the U.S. economy and calculates the gross domestic product (GDP) on a county-by-county basis. And while some areas are forecast to see some improvement, the U.S. economy overall is projected to lose 0.7% of its GDP with each degree of warming.
“Unmitigated climate change will be very expensive for huge regions of the United States,” stated Solomon Hsiang, Ph.D., Chancellor’s Associate Professor of Public Policy at UC Berkeley. “If we continue on the current path, our analysis indicates it may result in the largest transfer of wealth from the poor to the rich in the country’s history.”
29,000 simulations of the U.S. economy
The team, comprised of economists, climate scientists, and computational scientists, took a data-driven approach to quantify the impacts of climate change. Data availability and computing power enabled the team to determine the relationship between climate change and social cost. Temperature data was forecast through the end of the century.
The researchers ran 29,000 simulations of the U.S. economy, using three representative concentration pathways (RCPs). RCPs are greenhouse gas concentration (not emissions) trajectories commonly used for climate modeling and research. They represent potential climate futures, all of which are considered possible depending on how much greenhouse gases are emitted in the years to come.
The simulations calculated the “damage function” in terms of social and economic impact. The damage function combined the effects of climate change on agriculture, crime, health, energy demand, labor, and coastal damage from storms, plotted against temperature change in degrees Celsius in 2080 – 2099 relative to 1980 to 2010. The resulting graph, shown below, was created in MATLAB.

Total direct damage to U.S. economy, summed across all assessed sectors, as a function of global mean temperature change. The horizontal axis indicates forecasted temperature change from historical data (1980-2010). The black line is quadratic regression through all simulations; the shaded region is bounded by quantile regressions through the 5th and 95th percentiles. Image Credit: Hsiang, Kopp, Jina, Rising, et al (2017).
“The ‘hidden costs’ of carbon dioxide emissions are no longer hidden, since now we can see them clearly in the data,” said Amir Jina, Ph.D., a postdoctoral scholar in the department of economics at the University of Chicago. “The emissions coming out of our cars and power plants are reshaping the American economy. Here in the Midwest, we may see agricultural losses similar to the Dustbowl of the 1930s.”
The expected hit to agricultural yields is startling. Some areas can expect to see a 90% decline in yield, while the northern states will see an increased yield. (Map A below.) Similarly, energy expenditures (electricity demand) could decrease in northern states, while southern states will see an increase, largely due to the need for cooling. (Map C below.) Conversely, crime rates are likely to increase across the country, with larger increases in the northern states. (Maps G and H below.)

Spatial distributions of projected damages. County-level median values for average 2080 to 2099. Image Credit: Hsiang, Kopp, Jina, Rising, et al (2017)
Impacting global income equality as well
Obviously, this phenomenon is not constrained to the U.S. In 2015 Hsiang published research in Nature that showed, left unchecked, climate change is likely to reduce the income of the average person across the globe by 23% by the year 2100. But this impact will also be felt more acutely in some regions than in others.
Per Berkeley News, “The findings indicate climate change will widen global inequality, perhaps dramatically, because warming is good for cold countries, which tend to be richer, and more harmful for hot countries, which tend to be poorer.” The study showed India, Central America, South America, and Africa would be hardest hit. The poorest 40 percent of countries could see the average income decrease by 75 percent in 2100. The richest 20% of countries could see slight gains.
If you’re interested in seeing how climate change is affecting where you live, check out this interactive map.
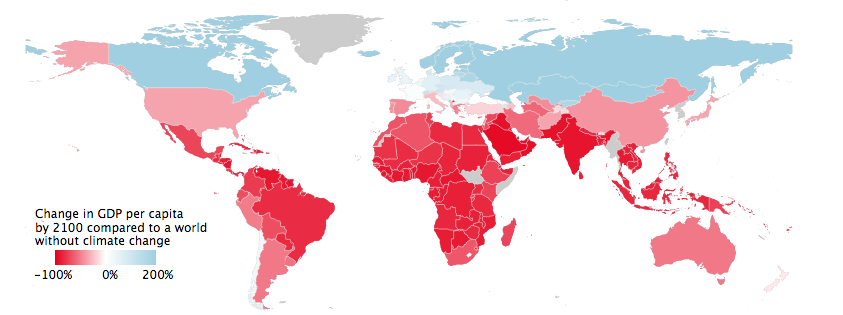
Image Credit: University of California, Berkeley. Burke, Hsiang, & Miguel (Nature, 2015)
“The data definitely don’t provide strong evidence that rich countries are immune from the effects of hot temperatures,” stated Hsiang. “Many rich countries just happen to have cooler average temperatures to start with, meaning that future warming will overall be less harmful than in poorer, hotter countries.”


Comments
To leave a comment, please click here to sign in to your MathWorks Account or create a new one.