Graphical Display Techniques – Part 2
In a recent post I discussed how to use different linestyles, colors, and marker properties to ensure that lines are markers that you superimpose on a plot will be visible, regardless of what the underlying picture is. Today I will show another technique that works for overlaying images or patches on a plot.
Contents
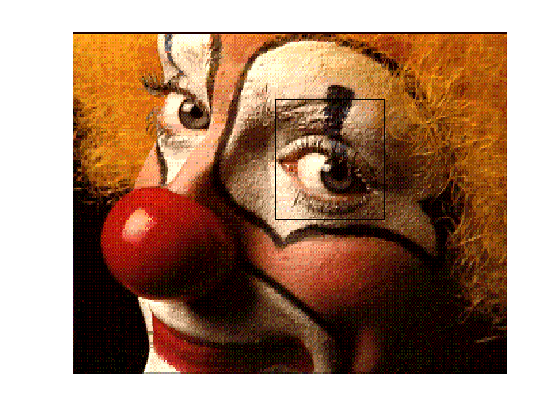
Let me show how to peek under a patch overlying an image.
load clown
image(X),colormap(map)
hold on
xx = [150 230 230 150]';
yy = [40 40 110 110]';
hp  = patch(xx,yy,'g');

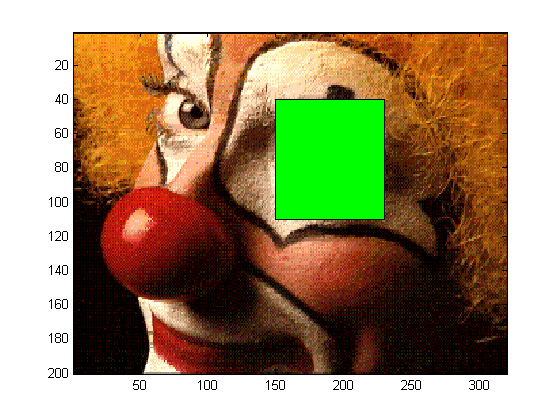
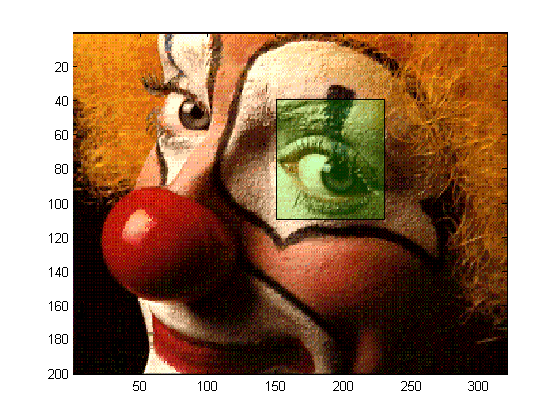
As you can see, the green patch I placed on top of the eye makes it impossible to see the covered region of the image. To get a hint at what lies underneath, I can change the transparency of the patch, by changing the transparency of the patch face.
set(hp,'FaceAlpha',0.2)
hold off

What Techniques Do You Use?
Do you have any interesting visualization techniques to share for combining more lines, patches, etc. with other graphical components? Please share them here.
- 类别:
- Graphics


评论
要发表评论,请点击 此处 登录到您的 MathWorks 帐户或创建一个新帐户。