Fitting a Circle, easily.
You may have noticed some recent changes in the format of this blog. Here’s what to expect on a regular basis – two topics
per week.
A file need not be long to be useful. Brett's pick this week, Izhak Bucher's Circle Fit, is only 5 lines long, excluding comments. But I really like Izhak's entry, and have had many opportunities to use it in
the several years since I downloaded it. Somehow, the requirement of fitting a circle to some points seems to occur with puzzling
frequency in my work. Izhak's CIRCFIT makes it easy, and is quite robust in most cases.
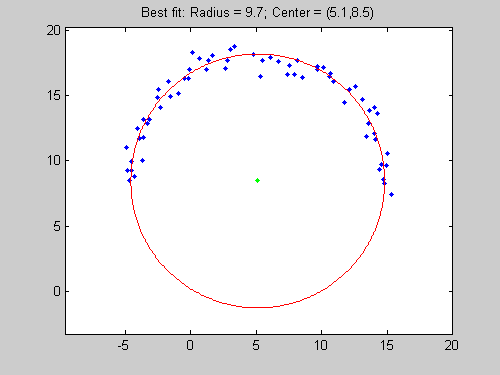
So how do you use Izhak's function? Consider these noisy data created for illustrative purposes:
 ...and then calculate and display the best-fit circle
 By the way, if it seems odd to you to use a RECTANGLE command to plot a circle, stay tuned for next week's Pick of the Week!
What other data-fitting problems do you commonly come up against, and how do you solve them?
Published with MATLAB® 7.6
- On Tuesdays Doug will provide MATLAB tutorials.
- On Fridays guest bloggers Jiro, Brett and Bob will highlight File Exchange submissions.
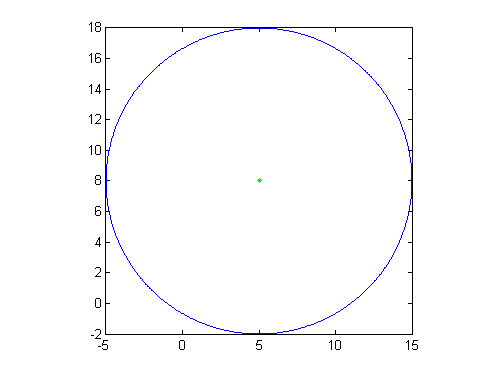
R = 10; x_c = 5; y_c = 8;
thetas = 0:pi/64:pi;
xs = x_c + R*cos(thetas);
ys = y_c + R*sin(thetas);

% Now add some random noise to make the problem a bit more challenging:
mult = 0.5;
xs = xs+mult*randn(size(xs));
ys = ys+mult*randn(size(ys));
Plot the points...
figure
plot(xs,ys,'b.')
axis equal
 ...and then calculate and display the best-fit circle
[xfit,yfit,Rfit] = circfit(xs,ys);
figure
plot(xs,ys,'b.')
hold on
rectangle('position',[xfit-Rfit,yfit-Rfit,Rfit*2,Rfit*2],...
    'curvature',[1,1],'linestyle','-','edgecolor','r');
title(sprintf('Best fit: R = %0.1f; Ctr = (%0.1f,%0.1f)',...
    Rfit,xfit,yfit));
plot(xfit,yfit,'g.')
xlim([xfit-Rfit-2,xfit+Rfit+2])
ylim([yfit-Rfit-2,yfit+Rfit+2])
axis equal
 By the way, if it seems odd to you to use a RECTANGLE command to plot a circle, stay tuned for next week's Pick of the Week!
What other data-fitting problems do you commonly come up against, and how do you solve them?
Published with MATLAB® 7.6
- カテゴリ:
- Picks


コメント
コメントを残すには、ここ をクリックして MathWorks アカウントにサインインするか新しい MathWorks アカウントを作成します。