Dynamic Date Ticks
Jiro's pick this week is Dynamic Date Ticks by our fellow MathWorker (and an Application Engineer) Ameya. If you work with time series data, this is a must-have utility.
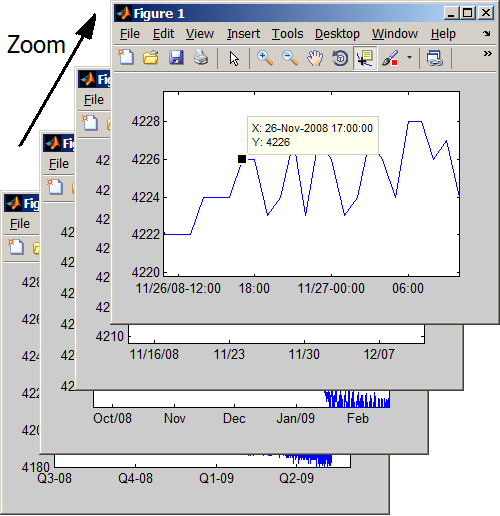
Have you ever wanted to plot a graph with dates along the x-axis? MATLAB has had a function called datetick for a long time, and it gives you a nice set of tick labels with date strings. But often times, you may want to interact with your plot by zooming and panning. Since datetick fixes the tick labels at the time of creation, the labels may disappear if you zoom in too far or pan away from the original limits. There are techniques you can employ to automatically update the tick labels after zooming and panning, or you can use Ameya's dynamicDateTicks.
Actually, there are a few entries on the File Exchange that provide automatic update of dateticks, one of which was selected as a Pick of the Week. Most of them leverage the callback behaviors of zoom and pan. What's unique about Ameya's function is that not only does it dynamically update the tick labels as you zoom and pan, it also shows year or day changes (so you always have the full date information), and displays data tips appropriately.

Comments
Give this a try and tell us what you think, or leave a comment for Ameya on the submission page.
- Category:
- Picks


Comments
To leave a comment, please click here to sign in to your MathWorks Account or create a new one.