
How do you create a mask from a variable-thickness open, freehand curve?
Brett's Pick this week is 2D Line Curvature and Normals, by Dirk-Jan Kroon.
Recently, I began working on an app to facilitate interactive image segmentations. Ultimately, I want to create a suite of tools that allow me to use some combination of automated and manual manipulations to create flexibly a complicated mask of my images. As part of that project, I want the ability to create closed or open (!) imfreehand or impoly regions, and to use those regions to modify my mask.
Creating masks from closed regions is easy with the imroi tools of the Image Processing Toolbox; the "createMask" method trivializes the process. But creating masks from open regions can produce some unexpected, and unwanted, results.
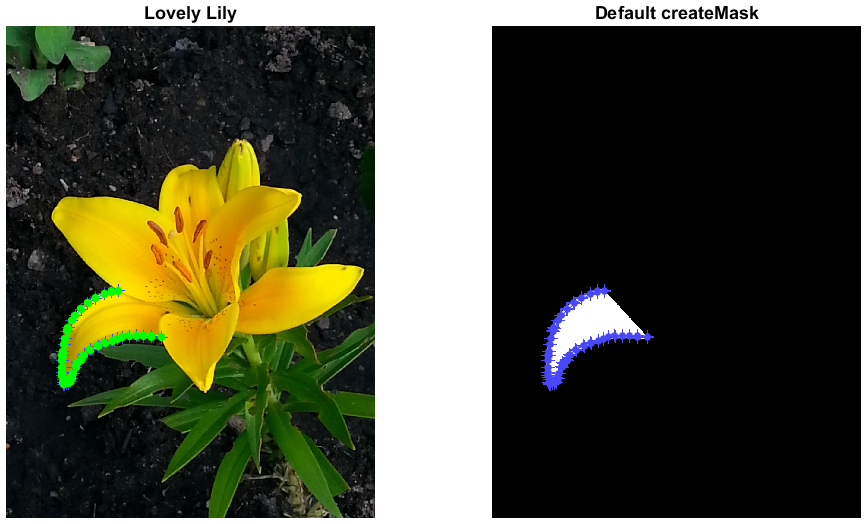
Suppose, for example, that I wanted to create a mask from a manual tracing of the lower left petal of the "yellow lily" image that ships with the Image Processing Toolbox:
I read in and display the image, and trace the boundary of interest:
lily = imread('C:\Program Files\MATLAB\R2015a\toolbox\images\imdata\yellowlily.jpg');
ax(1) = subplot(1,2,1);
imshow(lily)
title('Lovely Lily')
% I did this manually, saved the positions to a Mat-file:
% h = impoly(imgca,'closed',false);
load outlinedLily
h = impoly(imgca,xsys,'closed',false);
xsys = getPosition(h);
xs = xsys(:,1);
ys = xsys(:,2);
% (Note: you can do this with |imfreehand|, too, but I find that I can be
%  much more accurate with |impoly|.)
defaultMask = createMask(h);
hold on
plot(xs,ys,'r.','markersize',16);
If I simply use the createMask method, I get a mask of the filled region within the closed ROI:
ax(2) = subplot(1,2,2);
imshow(defaultMask);
title('Default createMask')

But that's not what I wanted! I could use bwperim (for example) on that mask, but then I would have to remove the effects of the unwanted region closing. What I really wanted was a thin "shell" around my drawn region, from which I could create my mask.
Enter Dirk's LineNormals2D.
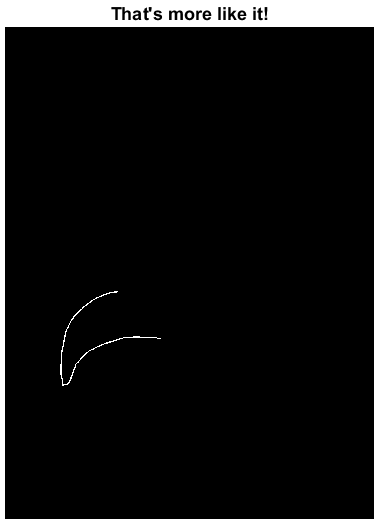
N = LineNormals2D(xsys); %Dirk-Jan!!!! This rocks!
thicknessMultiplier = 2;
posn = [xs-thicknessMultiplier*N(:,1) ys-thicknessMultiplier*N(:,2);
	flipud(xs+thicknessMultiplier*N(:,1)) flipud(ys+thicknessMultiplier*N(:,2))];
h = impoly(ax(2),posn);
xsys = getPosition(h);
xs = xsys(:,1);
ys = xsys(:,2);
plot(ax(1),xs,ys,'g.','markersize',16);
Now...
imshow(createMask(h),'parent',ax(2))
title('That''s more like it!')
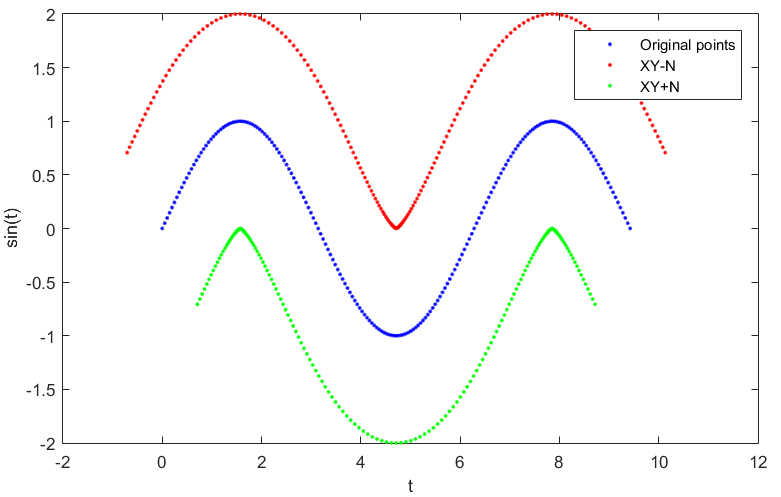
The line above, in which I used the output of LineNormals2D to create my "posn" vector, might seem a bit puzzling. In a nutshell, Dirk-Jan's function calculated the position of the normal at each point on my imroi. I subtract those values from, and then add them to, the points on my curve to calculate desired positions. (thicknessMultiplier just scales the amount of offset.) I use flipud to have the "inward points" flip around and start where the "outward points" left off:
t = 0:pi/64:3*pi;
xy = [t',sin(t)'];
N = LineNormals2D(xy);
plot(xy(:,1),xy(:,2),'b.')
plot(xy(:,1)-N(:,1),xy(:,2)-N(:,2),'r.')
plot(xy(:,1)+N(:,1),xy(:,2)+N(:,2),'g.')
legend({'Original points','XY-N','XY+N'})
xlabel('t')
ylabel('sin(t)')
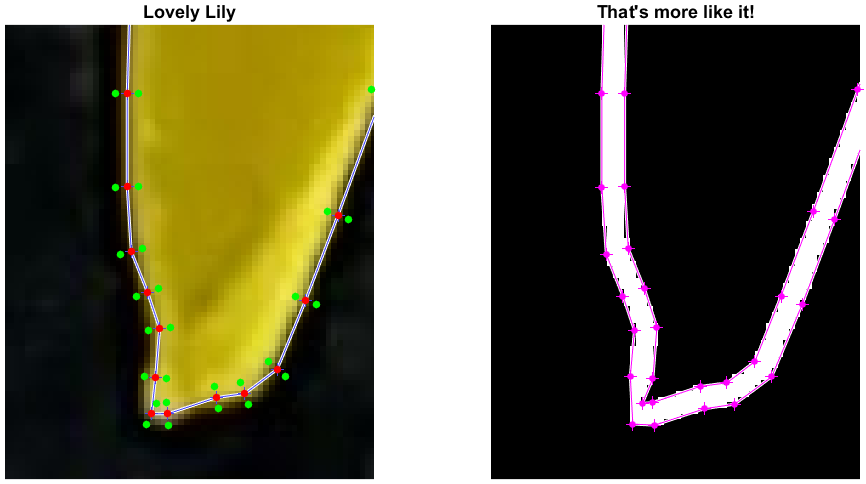
Zooming in, we can see what LineNormals2D did more explicitly:
h = impoly(ax(2),posn);
setColor(h,[1 0 1])
ax.xlim
set(ax,'xlim',[165 230],'ylim',[1120 1200])
There are undoubtedly other ways of creating this mask, but this is what initially occurred to me. Swag, of course, goes to Dirk-Jan for his fine code, but also to anyone who shows me another clever way to implement this functionality!
As always, I welcome your thoughts and comments.
- 类别:
- Picks


评论
要发表评论,请点击 此处 登录到您的 MathWorks 帐户或创建一个新帐户。