
R2020b: swarmchart
Jiro's Pick this week is swarmchart, a new visualization function in R2020b.
Following Sean's post from last week, I'd like to highlight a new function from the newest release of MATLAB.
Many, many years ago, I Picked a File Exchange entry called beeswarm plot. It's a vizualization that lets you see the distribution of the data along a dimension.
data = {randn(1, 25), randn(1, 100) + 1, randn(1, 300) - 0.5};
plotSpread(data, ...
    'xNames', {'one', 'two', 'three'}, ...
    'distributionMarkers', {'o', '+', '.'});

You can also see similar type of plots by searching for "violin plot".
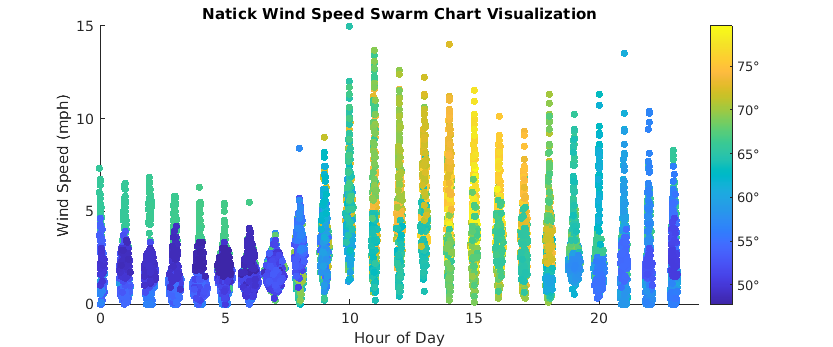
In R2020b, you can now create this type of visualization with the new function swarmchart.
data = [data{:}];
x = categorical([ones(1,25) 2*ones(1,100) 3*ones(1,300)],[1 2 3],["one" "two" "three"]);

clf
swarmchart(x,data)

If you are on an older release of MATLAB, you can make use of the entries on File Exchange, but I recommend you upgrade to the newest release to take advantange of the plethora of new features that come with it.
Comments
Give it a try and let us know what you think here.
- 범주:
- Picks


See Also
-

Beeswarm Plot
Blogs
-

2020 Index
Blogs
-


댓글
댓글을 남기려면 링크 를 클릭하여 MathWorks 계정에 로그인하거나 계정을 새로 만드십시오.