
Treble clefs, Unicode, SVG, strings, Bézier curves, kron, implicit expansion, and polyshape
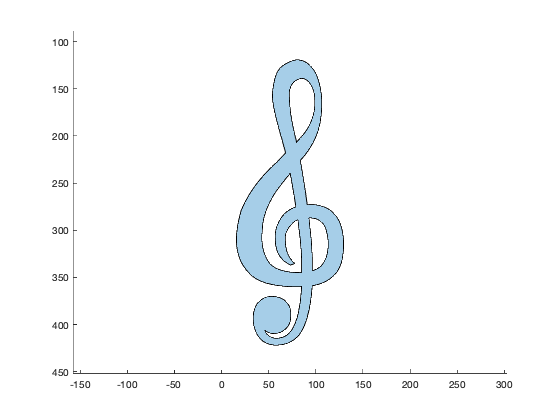
Today I will show you how I plotted this treble clef symbol in MATLAB:

My discovery and implementation process for doing this involved Unicode characters, SVG files, string processing, Bezier curves, kron, implicit expansion, and polyshape. I thought it was fun, and I learned a few things, so I wanted to share it.
As a personal project, I make specialized fingering charts for the French horn. I do this in MATLAB, of course. For one of these charts, I wanted to be able to place several treble clef symbols, precisely and with high quality. That's how I got started on this quest.
First, I wondered if there is a Unicode symbol for treble clef (also known as the G clef). There is. One online resource I like to use for Unicode is FileFormat.info, which has this info page for the treble clef:
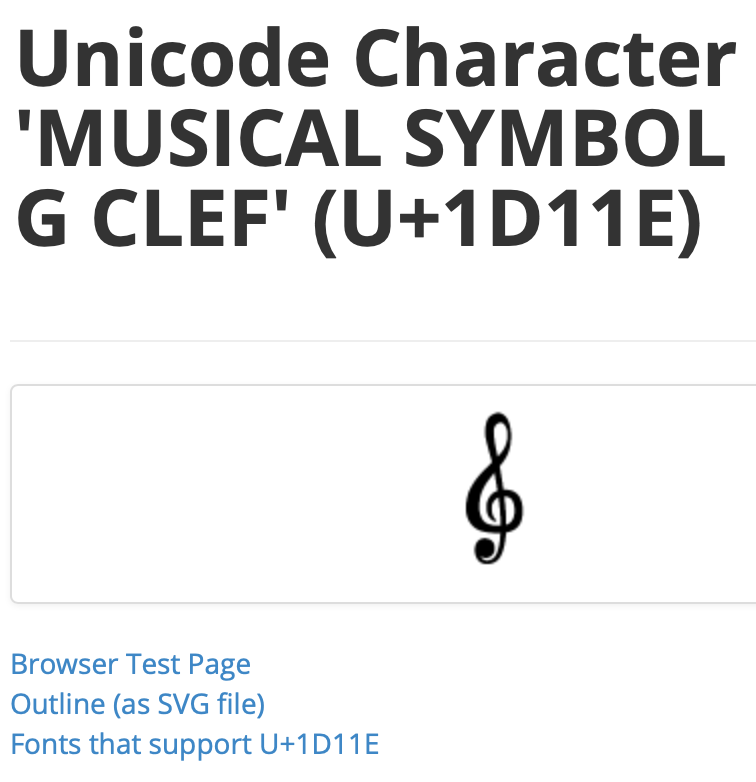
But I wasn't sure that using the Unicode character directly was really going to work out for me. The precise positioning and size of a Unicode character is too dependent on which font one uses. But the line "Outline (as SVG file)" on that info page caught my eye. Maybe I could use that?
I don't know that much about SVG files, but I downloaded the file and looked at it in a text editor. There didn't seem to be much to it:
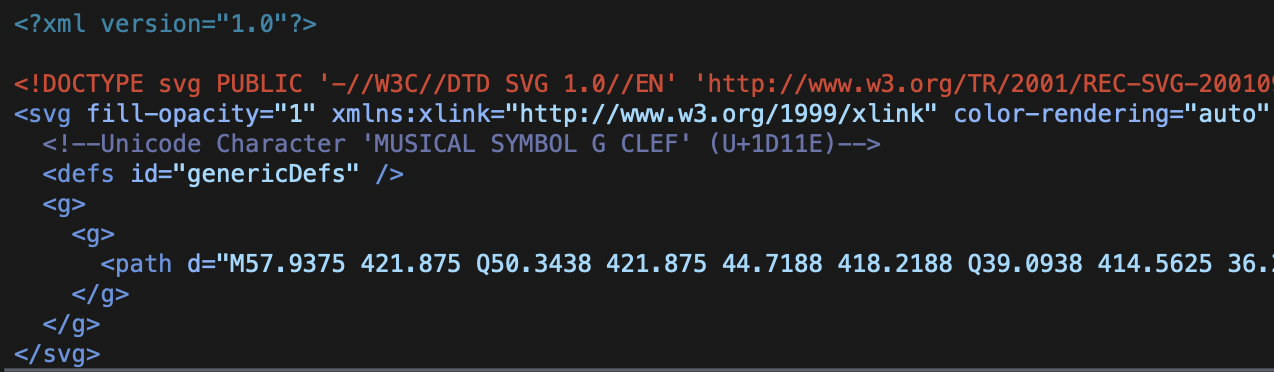
Clearly, I needed to understand more about an SVG path. I found this w3.org page that explains SVG paths in detail. Fortunately for me, since I just wanted to try a quick prototype, the path in the treble clef outline file contained only a few commands:
- "M" - move to a position
- "L" - draw a line to a position
- "Q" - draw a quadratic Bezier curve segment using three points
- "Z" - close the current curve
I certainly didn't want to write a fully general SVG path parser just to do a prototype. Instead, I used some MATLAB string processing functionality to break the path string down into easily processable chunks. Here's the string I was dealing with.
load clef_path
clef_path
clef_path =

    "M57.9375 421.875 Q50.3438 421.875 44.7188 418.2188 Q39.0938 414.5625 36.2812 407.6719 Q33.4688 400.7812 33.4688 393.75 Q33.4688 387.2812 35.7188 381.7969 Q37.9688 376.3125 42.75 373.2188 Q47.5312 370.125 53.7188 370.125 Q59.625 370.4062 63.8438 372.5156 Q68.0625 374.625 70.7344 378.7031 Q73.4062 382.7812 73.4062 389.8125 Q73.4062 397.125 70.7344 401.2031 Q68.0625 405.2812 64.2656 407.3906 Q60.4688 409.5 54.8438 409.5 Q52.0312 409.5 50.0625 408.6562 Q48.0938 407.8125 45.8438 405.5625 Q46.9688 409.7812 50.2031 412.1719 Q53.4375 414.5625 57.9375 414.5625 Q65.3906 414.5625 71.0859 409.6406 Q76.7812 404.7188 80.3672 391.5 Q83.9531 378.2812 84.7969 360 L81 360 Q60.1875 360 46.4062 355.7812 Q32.625 351.5625 24.1875 339.4688 Q15.75 327.375 15.75 309.9375 Q15.75 296.4375 20.8125 279 Q27 264.375 36.2812 252 Q45.5625 239.625 59.625 226.6875 L67.9219 217.9688 L64.125 204.1875 Q57.9375 182.25 55.9688 172.9688 Q54 163.6875 54 157.5 Q54 149.625 56.5312 139.2188 Q59.0625 128.8125 66.9375 124.0312 Q74.8125 119.25 80.4375 119.25 Q87.1875 119.25 93.6562 125.1562 Q100.125 131.0625 103.2188 142.5938 Q106.3125 154.125 106.3125 165.375 Q106.3125 174.375 104.625 184.7812 Q102.9375 195.1875 98.0156 205.0312 Q93.0938 214.875 85.7812 223.3125 L83.5312 225.9844 Q86.0625 241.1719 88.875 258.75 L90.8438 272.9531 L95.0625 272.8125 Q105.1875 272.8125 113.3438 277.6641 Q121.5 282.5156 125.4375 292.0078 Q129.375 301.5 129.375 314.4375 Q129.375 327.9375 126.2812 336.5156 Q123.1875 345.0938 115.6641 351 Q108.1406 356.9062 96.0469 358.875 Q94.9219 378.8438 90.2812 394.1719 Q85.6406 409.5 77.4141 415.6875 Q69.1875 421.875 57.9375 421.875 ZM80.4375 344.8125 L84.9375 344.6719 L84.9375 336.0938 Q84.9375 327.2344 84.0234 316.3359 Q83.1094 305.4375 80.8594 288.8438 Q77.3438 290.25 74.25 293.4141 Q71.1562 296.5781 69.3281 300.5859 Q67.5 304.5938 67.5 307.9688 Q67.5 317.5312 69.6094 323.5781 Q71.7188 329.625 77.625 335.25 L73.125 336.9375 Q67.2188 333.8438 63.7031 330.0469 Q60.1875 326.25 58.5 320.7656 Q56.8125 315.2812 56.8125 306.5625 Q56.8125 300.0938 59.5547 293.625 Q62.2969 287.1562 66.9375 282.375 Q71.5781 277.5938 78.8906 275.2031 L77.0625 264.375 Q74.5312 249.0469 72.7031 239.4844 Q63.2812 251.0156 56.8125 260.1562 Q52.3125 267.1875 48.6562 275.625 Q45 284.0625 43.875 292.2188 Q42.75 300.375 42.75 308.8125 Q42.75 318.9375 46.9688 328.5 Q51.1875 338.0625 60.1875 341.4375 Q69.1875 344.8125 80.4375 344.8125 ZM96.1875 343.125 Q103.5 340.5938 106.875 336.2344 Q110.25 331.875 111.6562 326.4609 Q113.0625 321.0469 113.0625 314.4375 Q113.0625 307.125 111.0938 300.375 Q109.125 293.625 104.7656 290.25 Q100.4062 286.875 92.8125 286.875 L92.5312 286.875 Q94.5 302.4844 95.3438 313.9453 Q96.1875 325.4062 96.1875 334.6875 L96.1875 343.125 ZM79.4531 206.4375 Q86.9062 198.9844 90.7031 192.9375 Q94.5 186.8906 96.75 179.3672 Q99 171.8438 99 165.375 Q99 157.5 97.5938 152.4375 Q96.1875 147.375 92.8125 143.1562 Q89.4375 138.9375 84.9375 138.9375 Q81.5625 139.2188 78.1875 141.6094 Q74.8125 144 73.2656 147.7969 Q71.7188 151.5938 71.7188 154.9688 Q71.7188 159.4688 72.5625 169.7344 Q73.4062 180 77.625 198.5625 L79.4531 206.4375 Z"
I started with putting each command on a separate line.
commands = 'MQLZ';
for k = 1:length(commands)
    ck = string(commands(k));
    clef_path = replace(clef_path,ck,newline + ck);
end
And then I split up the string by line breaks to make a string array.
clef_path = splitlines(clef_path);
clef_path(1:15)
ans =

  15×1 string array

    ""
    "M57.9375 421.875 "
    "Q50.3438 421.875 44.7188 418.2188 "
    "Q39.0938 414.5625 36.2812 407.6719 "
    "Q33.4688 400.7812 33.4688 393.75 "
    "Q33.4688 387.2812 35.7188 381.7969 "
    "Q37.9688 376.3125 42.75 373.2188 "
    "Q47.5312 370.125 53.7188 370.125 "
    "Q59.625 370.4062 63.8438 372.5156 "
    "Q68.0625 374.625 70.7344 378.7031 "
    "Q73.4062 382.7812 73.4062 389.8125 "
    "Q73.4062 397.125 70.7344 401.2031 "
    "Q68.0625 405.2812 64.2656 407.3906 "
    "Q60.4688 409.5 54.8438 409.5 "
    "Q52.0312 409.5 50.0625 408.6562 "
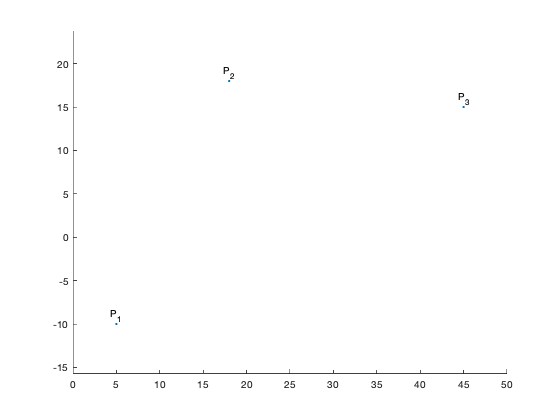
Now I need to explain about those "Q" commands. They indicate the drawing of a quadratic Bezier curve using three control points (the current point and the two additional points listed following the "Q" character). I wasn't familiar with the mathematics of drawing Bezier curves, but I quickly found Mike Garrity's old graphics blog post on the subject. Here's a brief snippet of explanation and code from that old post.
P1 = [ 5; -10];
P2 = [18;  18];
P3 = [45;  15];

cla
placelabel(P1,'P_1');
placelabel(P2,'P_2');
placelabel(P3,'P_3');
xlim([0 50])
axis equal
[Mike's explanation] And we've still got $t$ going from 0 to 1, but we'll use second-order polynomials like this:
$$P(t) = (1-t)^2 P_1 + 2 (1-t) t P_2 + t^2 P_3$$
These are known as the Bernstein basis polynomials.
We can use the kron function to evaluate them.
t = linspace(0,1,101);
P = kron((1-t).^2,P1) + kron(2*(1-t).*t,P2) + kron(t.^2,P3);

hold on
plot(P(1,:),P(2,:))
hold off
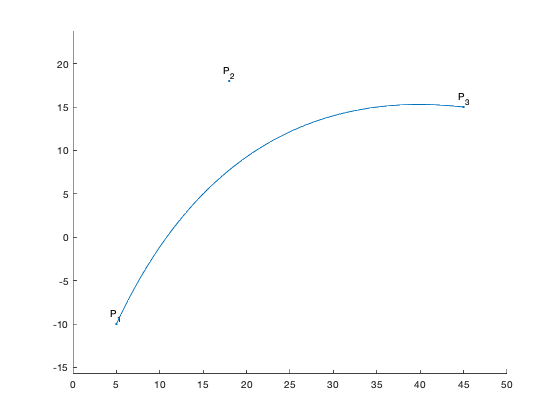
Notice that the resulting curve starts at $P_1$ and ends at $P_3$. In between, it moves towards, but doesn't reach, $P_2$. [End of Mike's explanation]
The kron function, used by Mike, computes something called the Kronecker tensor product. However, since implicit expansion was introduced in MATLAB three years ago, this is more easily computed simply by using element-wise multiplication.
t = t;
P = ((1-t).^2 .* P1) + (2*(1-t) .* t .* P2) + (t.^2 .* P3);
So, that's the computation I need to perform for each "Q" command in the SVG path. I don't think I need 101 points to draw each Bezier curve segment, though; let's go with 21. Also, I'm going to change the orientation to be a column.
t = linspace(0,1,21)';
Now let's build up x and y vectors based on each SVG path command.
x = zeros(0,1);
y = zeros(0,1);

x_current = 0;
y_current = 0;

for k = 1:length(clef_path)
    if clef_path(k) == ""
        continue
    end

    % Get the command character and a vector of the numeric values after
    % the command.
    command = extractBefore(clef_path(k),2);
    remainder = extractAfter(clef_path(k),1);
    values = str2double(split(remainder));

    switch command
        case "M"
            % Move to a position. Put a NaN-valued point in the vector.
            x = [x ; NaN];
            y = [y ; NaN];
            x_current = values(1);
            y_current = values(2);
            x(end+1,1) = x_current;
            y(end+1,1) = y_current;

        case "L"
            % Draw a line segment from the current point to the specified
            % point.
            x_current = values(1);
            y_current = values(2);
            x(end+1,1) = x_current;
            y(end+1,1) = y_current;

        case "Q"
            % Draw a quadratic Bezier curve segment using the current point
            % and the two additional points as control points.
            pt1 = [x_current y_current];
            pt2 = [values(1) values(2)];
            pt3 = [values(3) values(4)];
            pts = ((1-t).^2 .* pt1) + (2*(1-t).*t .* pt2) + ...
                (t.^2 * pt3);
            x = [x ; pts(:,1)];
            y = [y ; pts(:,2)];

            x_current = values(3);
            y_current = values(4);

        case "Z"
            % TODO: curve-closing logic
    end
end
Now, let's take a big breath and see what we've got!
plot(x,y)
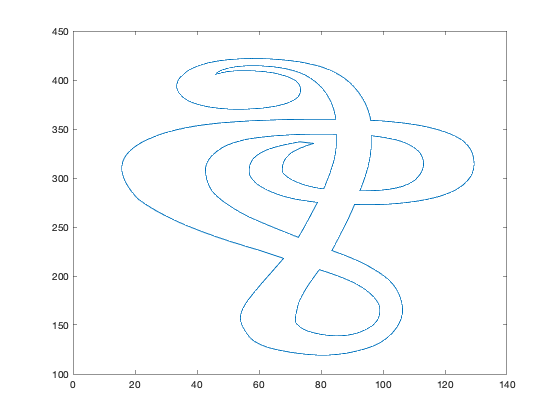
So close! But upside down and oddly squished. Both those problems are easily fixed.
axis equal
axis ij
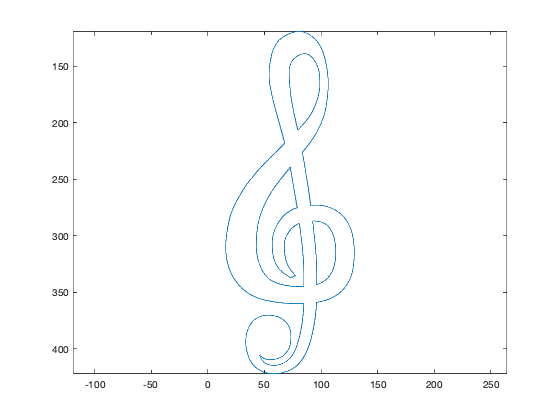
Even closer! But how do we get a filled shape?? That's where polyshape comes in. We've got x and y vectors containing four segments separated by NaN values. The four segments are for the outer curve, plus the outlines of the three holes or voids in the treble clef. The constructor for polyshape knows exactly how to deal with that kind of data. It can figure out automatically which curves are outer boundaries and which curves are inner boundaries. The resulting polyshape object can be easily plotted.
Note: the duplicate points warning below can be safely ignored. If I were doing something other than a quick prototype, I would construct the data more carefully to avoid it.
There you have it. You can plot a treble clef in MATLAB.
What will you do with your new-found power?
p = polyshape(x,y);
plot(p)
axis equal
axis ij
Warning: Polyshape has duplicate vertices, intersections, or other
inconsistencies that may produce inaccurate or unexpected results. Input data
has been modified to create a well-defined polyshape.
function placelabel(pt,str)
% Utility function for code demonstrating Bezier curve plotting
    x = pt(1);
    y = pt(2);
    h = line(x,y);
    h.Marker = '.';
    h = text(x,y,str);
    h.HorizontalAlignment = 'center';
    h.VerticalAlignment = 'bottom';
end


Comments
To leave a comment, please click here to sign in to your MathWorks Account or create a new one.