SAE AutoDrive II – Y1 MathWorks Simulation Challenge Winners
In this blog, Akshra will showcase the 1st and 3rd place winners of the MathWorks Simulation Challenge award for the SAE AutoDrive II Year 1 competition, and how they used MATLAB and Simulink to model their systems.
Introduction
SAE AutoDrive II is a 4-year collegiate design competition, with 10 teams from U.S and Canada participating. The high-level technical goal for the end of this competition is to navigate an urban driving course in an automated driving mode as described by SAE Level 4. Each year MathWorks challenges teams to use Simulation via a MathWorks Simulation Challenge year-end presentation.
Simulation in an important tool to have in your system development toolkit. For automated driving systems, testing fusion, planning, and controls algorithms require the use of a multitude of test scenarios. These test scenarios can range from a straight road test to an edge case test for an Automatic Emergency Braking algorithm. Simulation provides a safe and robust environment to design, test, and validate your systems.
This blog will briefly cover the 1st and 3rd place winners of the 2022 Challenge (University of Toronto and The Ohio State University), their system design, and how they used MathWorks tools to help achieve overall competition objectives. The teams were judged based on how they used the tools to perform the following tasks in simulation:
- Simulate waypoint following
- Simulate traffic signals and signs interactions
- Simulate collision avoidance
- Test generated code with simulation
University of Toronto (aUTornoto)
The aUToronto won 1st place in the AutoDrive II Y1 MathWorks Simulation Challenge.
System Requirements and Metrics
The team began with defining their high-level functional system requirements and baseline scenarios to test them.
- System shall generate and follow waypoints that lead to a given goal position
- System shall obey traffic sign and light rules
- System shall avoid obstacles on the road
These requirements were then broken into planning and controls requirements. Some of them include:
- Planner shall mark as occupied all cells containing obstacles and avoid them
- Planner shall assign zero speed at any stop sign and stop light
- Controller shall generate a speed profile and command vehicle torque to achieve it
Once the system requirements and tests were written, the team had to define metrics that would evaluate performance across scenarios. Some of these metrics are summarized in Table 1. These metrics were mapped to the three tasks of waypoint following, lights and signs interactions, and obstacle avoidance. Acceleration and jerk metrics were also considered in order to quantify passenger comfort performance.
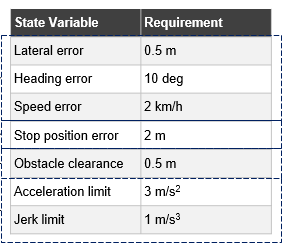
Table 1: System Metrics (©aUToronto)
Software Architecture
The team’s software architecture had two key features:
- Modularity – Models and functions were developed separately and connected using Simulink linked subsystems/reference subsystems. When you add a masked library block or a Subsystem block from a library to a Simulink model, a referenced instance of the library block is created. Such referenced instance of a library block contains link or path to the parent library block. The link or path allows the linked block to update when the library block is updated.
- Model-Based Design Workflow – This workflow begins with a V diagram (Figure 1) containing requirements, design, implementation, then integration and testing. System-level and subsystem-level design, implementation, and unit tests make a successful implementation of the model-based design workflow.
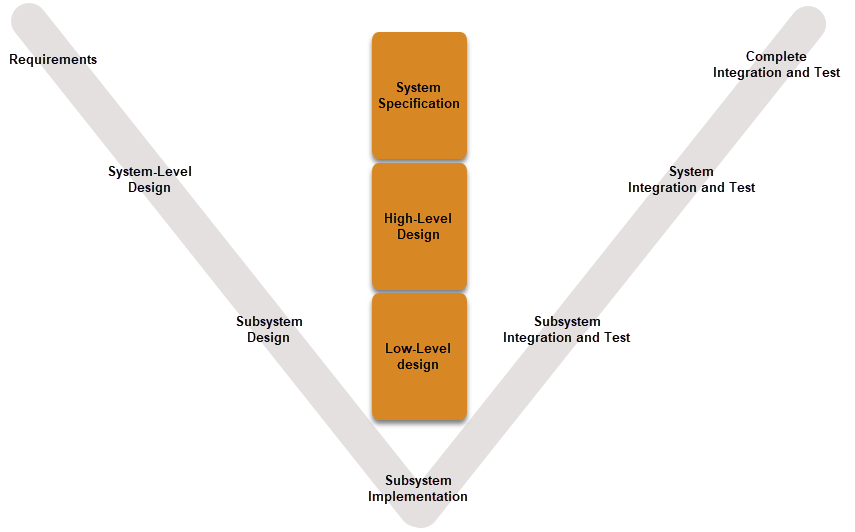
Figure 1: V Diagram for Model-Based Design Workflow
The team’s system was split into simulator, planning, and controls modules. Figure 2 shows the connected Simulink blocks for the three modules.

Figure 2: High-Level Code Architecture in Simulink (©aUToronto)
The simulator module models vehicle dynamics and scenario generation, and outputs vehicle states and road actors. The planning module computes optimal global route and local waypoints, and outputs reference waypoints. The Controls module preprocesses these waypoints and performs feedback control, and outputs actuator commands
Planning Module
The team evaluated 5 different planning algorithms across weighted criteria of solution optimality, dynamic feasibility, processing time, and collision avoidance. A Pugh matrix was constructed (figure 3) in order to select a global route planner and a local waypoint planner. The A* algorithm scored the highest for path optimality, hence was chosen as the global planner. The Hybrid A* algorithm scored top points for path smoothness, hence was chosen as the local planner.

Figure 3: Pugh Matrix for Planner (©aUToronto)
Controls Module
The team evaluated 6 algorithms across weighted criteria of disturbance rejection, tracking error, constraint enforcement, and computation time. 2 Pugh matrices were created in order to select lateral and longitudinal controllers. The Model Predictive Controller was chosen for both. First, frame transforms to local inertial and vehicle body fixed frames were performed, then waypoint resampling was done to interpolate the planning path. Velocity scheduling was done to create a smooth velocity profile for the planned path. The MPC’s output is fed through a PI controller to reject model mismatch errors. Finally feedforward actuator mapping is performed. These processes are shown in Figure 4.
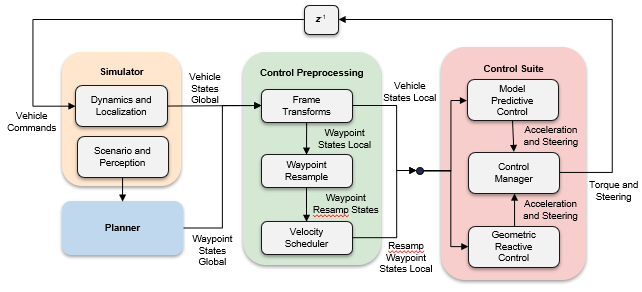
Figure 4: Control Design (©aUToronto)
Simulation Results
The team tested their system in 3 scenarios – waypoint following, obstacle avoidance, and signals and signs interactions. All simulation results were obtained in Simulink with the help of ROS2 bridges. Performance plots were generated for all (Figure 5) and simulation insights were obtained.
Waypoint following – Speed and lateral position errors met the requirement. However, state error performance had to be traded off in order to meet team drive quality metrics.
Obstacle avoidance – The minimum distance to obstacle exceeded requirements. However, horizon length had to be traded off in order to reduce computation cost.
Signals and signs – The vehicle was able to exceed the maximum stopping distance requirement. However, planning and control horizon had to be increased to meet braking distance requirements.

Figure 5: Simulation Performance Plots (©aUToronto)
Challenges and Solutions
The team faced a few challenges along the way. One of these challenges was planner-control synchronization issues. The main causes for this were ROS2 asynchronous communication issues, algorithm latency, and distance between waypoints. The team solved this by building a waypoint resampler that could interpolate/extend paths as needed and guarantee control feasibility. Another challenge was the planner’s path feasibility while reducing computation speed for scenarios involving corners. The team expanded their error handling and time-out functionalities to handle this issue.
The Ohio State University (Buckeye AutoDrive)
The Buckeye AutoDrive team won 3rd place in the AutoDrive II Y1 Simulation Challenge.
System Architecture
The team developed Simulink models that performed controls, path planning, perception and decision-making tasks. The path planner took velocity feedback as input from the controllers and output path information. The controllers took information from the decision-making logic and perception blocks, and output torque, brake, and steering commands to the vehicle dynamics block, which then sent ego vehicle information to the scenario ground truth block.
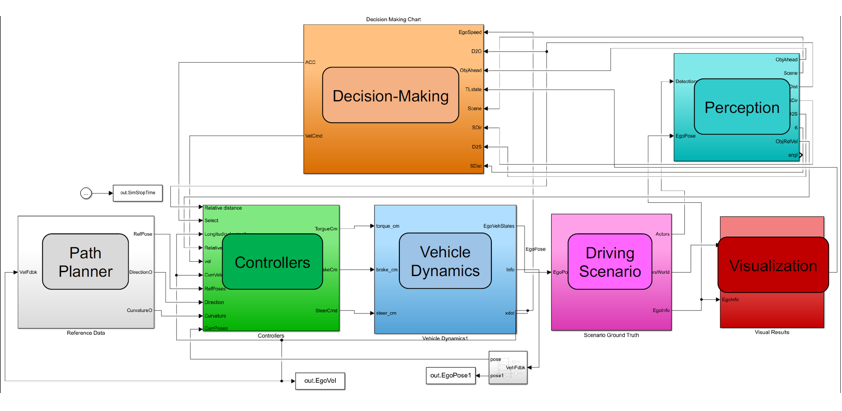
Figure 6: Overall System (©Buckeye AutoDrive)
Waypoint Following Using Controllers
The team performed the task of waypoint following by using the Stanley and ACC controllers for longitudinal, and Stanley and Pure pursuit for lateral control (figure 7).

Figure 7: Controllers for Waypoint Following (©Buckeye AutoDrive)
The longitudinal Stanley controller takes in reference velocity and current ego vehicle velocity, and outputs longitudinal acceleration and deceleration commands. These outputs are then converted to torque and brake commands to be sent to the Vehicle Dynamics block.
The lateral Stanley and Pure pursuit controllers output steering commands which are fed to the Vehicle Dynamics block as steering wheel angle. Parameters such as yaw rate feedback gain, steering angle feedback gain, position gain, lookahead distance, and vehicle set speed were tuned and set by the team. Figure 8 compares lateral heading angle plots for the chosen controllers.
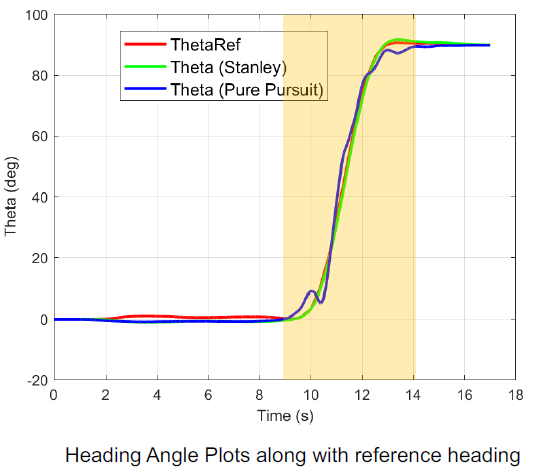
Figure 8: Heading Angle Plots Comparisons (©Buckeye AutoDrive)
Signals and Signs Interactions
The team fused radar and camera sensor data using the Multi Object Tracker block. The decision-making Simulink model contains Stateflow logic that makes decisions for collision avoidance and emergency states to intervene when necessary. The collision avoidance logic is as follows: if an object was detected with X m, the model switches to ACC. If a technical failure was detected, the vehicle went o the Emergency state, where if an object was detected within x m, brake is directly accessed. Figure 9 shows the navigation logic for multiple scenes. The state is chosen based on Scene IDs.

Figure 9: Navigation Logic (©Buckeye AutoDrive)
Collision Avoidance
Adaptive Cruise Control (ACC) was switched on when objects were detected within 25m of the ego vehicle. ACC parameters such as default spacing, prediction horizon, acceleration range, sample time, and maximum velocity were set. Time gap was modified based on the detected scene. Figure 10 shows the ACC system.
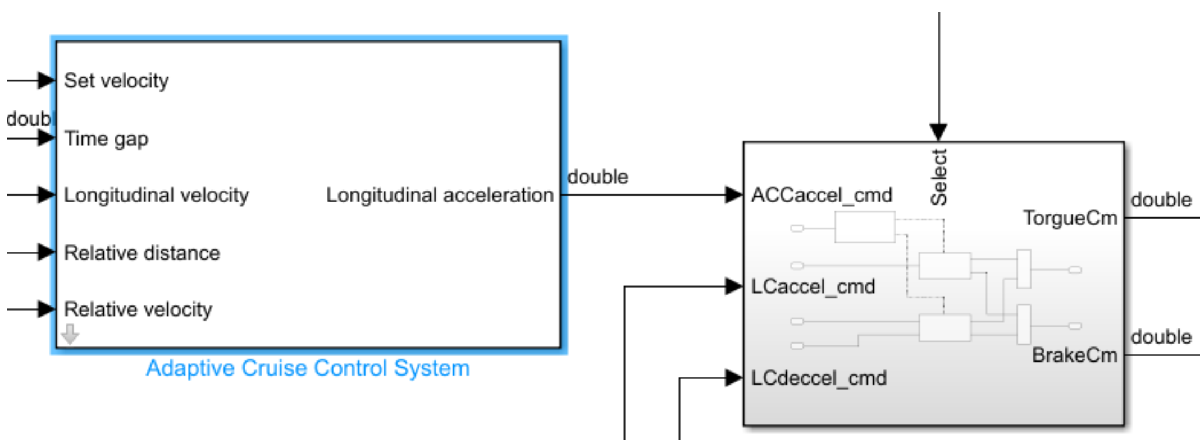
Figure 10: ACC System (©Buckeye AutoDrive)
Figure 11 shows lead and ego vehicle velocities, and relative and safe distance results when time gap was set to 1. The ego vehicle never exceeded set velocity.
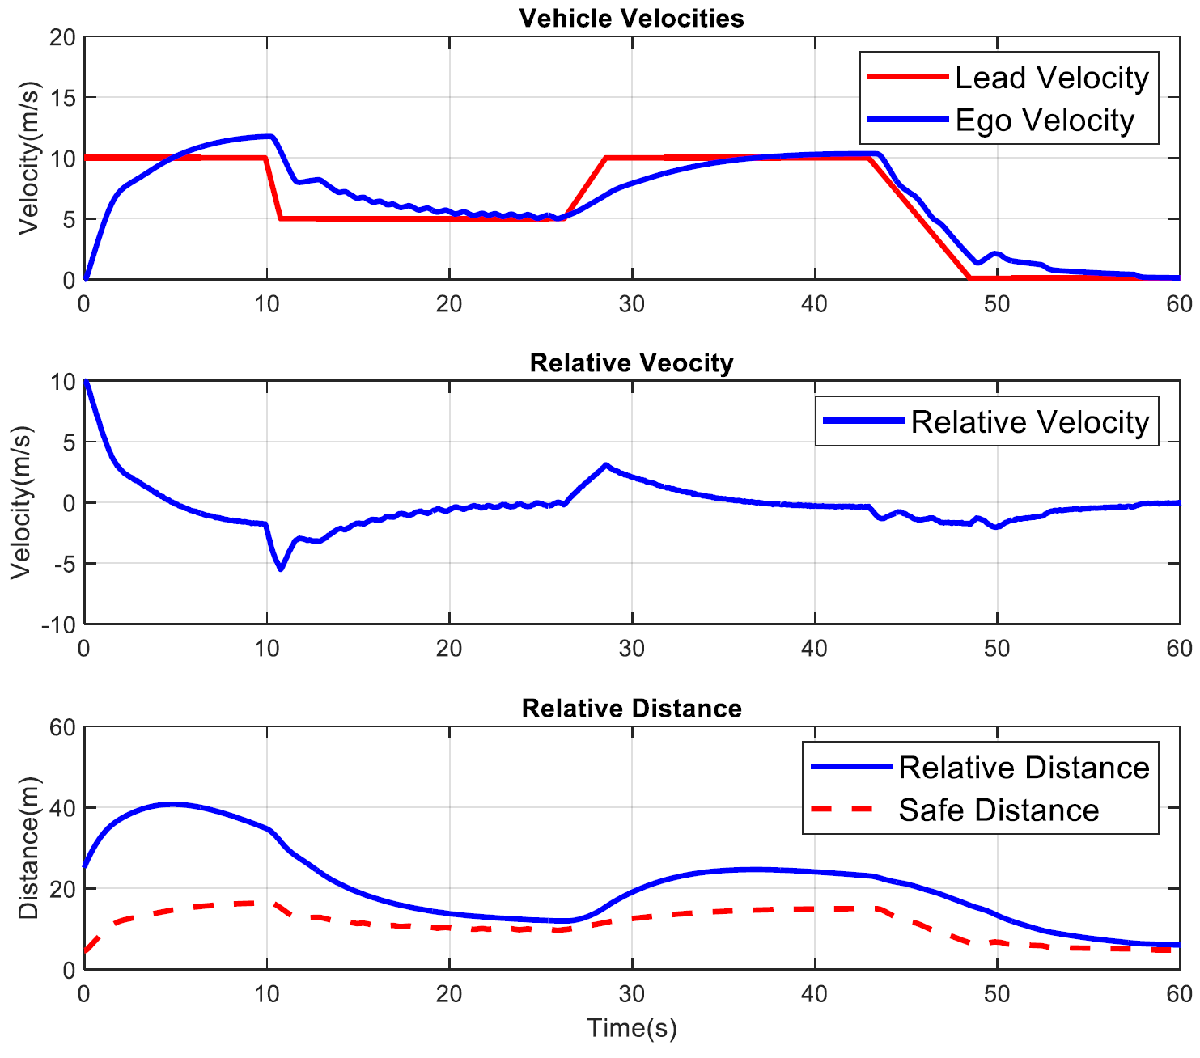
Figure 11: Collision Avoidance Results (©Buckeye AutoDrive)
Automatic Code Generation and SIL Testing
The team generated code using Embedded Coder. More information about Embedded Coder can be found here. The Simulink Coverage App was used to visualize model coverage status, link requirements, and create test cases. This Student Lounge blog shows how to write and link requirements to blocks, and verify and validate these requirements using test cases. Metrics such as overall average and maximum CPU utilization, and average and maximum execution times were evaluated. The system passed all the team set execution time and code coverage metrics.
The team also performed Model-in-the-loop (MIL) and Software-in-the-loop (SIL) for their system. MIL and SIL results were compared using the SIL/PIL Manager App. The SIL/PIL Manager is an app that provides a simplified workflow for verifying generated code. The model was first simulated in normal mode, then in SIL mode. The results from the two were compared. They were nearly identical. Figure 12 shows these results in Simulink Data Inspector.
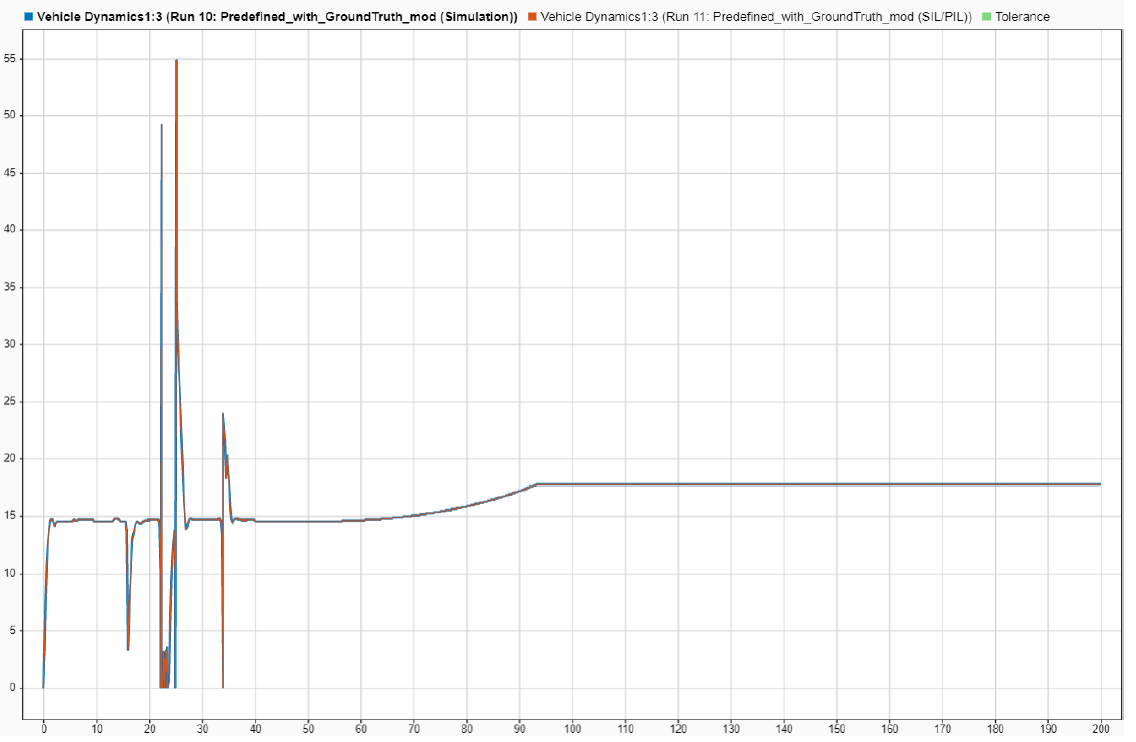
Figure 12: MIL and SIL Comparison Results (©Buckeye AutoDrive)
Challenges and Solutions
The team faced a few challenges along the way, mainly in code generation. They noticed a sampling time mismatch between different subsystems, Usage of transition blocks in order to get a uniformed sample rate fixed this problem. The team also replaced their switch block with a saturation block to solve mismatch of velocity and direction inputs to their controller block. Lower velocity values were causing the simulations to slow down. The team put a lower velocity limit of 0.001m/s to solve this problem.
Conclusion
In summary, the winning teams of the AutoDrive II Y1 MathWorks Simulation Challenge used MATLAB and Simulink to design, test, and validate their planning and controls systems. University of Toronto’s team performed automated testing of their system-level requirements, and used Pugh matrices to evaluate multiple planners and controllers. The Ohio State University’s team switched between operation modes for navigation using Stateflow, and compared system performance in SIL and MIL.
- Category:
- Automotive,
- MATLAB,
- Simulink,
- Team achievements


Comments
To leave a comment, please click here to sign in to your MathWorks Account or create a new one.