
GUI Layout (Part 2)
This is Part 2 of 3 Pick of the Week entries on GUIs, written by guest blogger Jiro
In Part 1, I talked about how I use the ResizeFcn property of the figure to adjust the layout of my UI controls. Well, I'm always looking for easier ways to do layouts.
Jerome Briot wrote these utility tools SETPOS and GETPOS that give you more flexibility in defining the positions of objects. With these, you can provide individual units for the
four numbers that define the Position property:
 This function will allow me to do precise positioning of UIs with fewer lines of code. Thanks Jerome! Next week, I will introduce
a different tool that assists in the overal GUI design. Stay tuned for Part 3...
Comments?
Tell us what you think about when you are laying out your GUI components. Is it readability? Or is it the level of informational
content?
Written by Jiro Doke, Senior Applications Engineer, The MathWorks, Inc.
This function will allow me to do precise positioning of UIs with fewer lines of code. Thanks Jerome! Next week, I will introduce
a different tool that assists in the overal GUI design. Stay tuned for Part 3...
Comments?
Tell us what you think about when you are laying out your GUI components. Is it readability? Or is it the level of informational
content?
Written by Jiro Doke, Senior Applications Engineer, The MathWorks, Inc.
 % Use "normalized" for X and Width.
 % Use "pixels" for Y and Height.
 setpos(h,'0.25nz 100px 0.5nz 300px');
There are other nice features, such as incrementing by certain values:
 % Increase the width by 200 pixels
 setpos(h,'# # +200px #');
Or positioning objects relative to other objects:
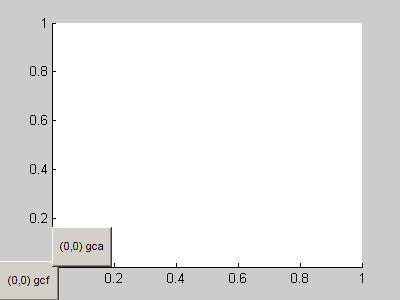
  setpos(figure, '# # 400px 300px');
  u(1) = uicontrol('string', '(0,0) gcf');
  setpos(u(1), '0 0 60px 40px')
  u(2) = uicontrol('string', '(0,0) gca');
  setpos(u(2), '0 0 60px 40px', gca)
This function will allow me to do precise positioning of UIs with fewer lines of code. Thanks Jerome! Next week, I will introduce
a different tool that assists in the overal GUI design. Stay tuned for Part 3...
Comments?
Tell us what you think about when you are laying out your GUI components. Is it readability? Or is it the level of informational
content?
Written by Jiro Doke, Senior Applications Engineer, The MathWorks, Inc.
- Category:
- GUI or GUIDE,
- Picks


See Also
-

GUI Layout (Part 3)
Blogs
-
Olympic medals
Blogs
-
GUI Layout (Part 1)
Blogs


Comments
To leave a comment, please click here to sign in to your MathWorks Account or create a new one.