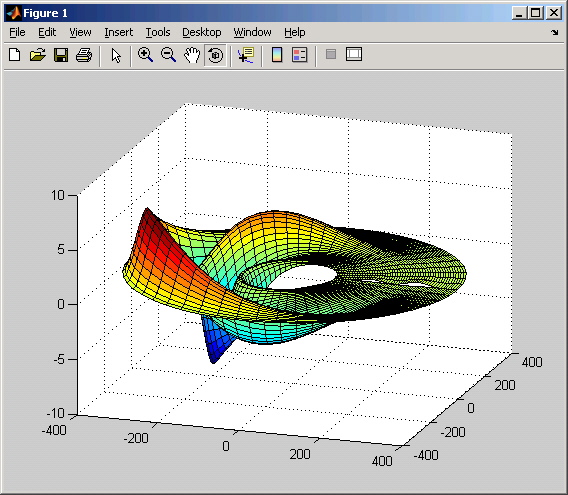
Three dimensional polar plots
This blog has been going on for a few years now, and you may have noticed that the name has recently changed. Scott is still happily doing MATLAB stuff at the MathWorks but has decided to step aside and let me run the blog. I am going to need help, so I have started to enlist other Applications Engineers to help find the best files on the Exchange each week. I can also use the help from readers, so if you have a favorite file that has not been picked yet, please let me know (yes, even if it happens to be one you wrote!).
This week’s pick actually comes from our California based Application Engineer, Craig. This is what he had to say about 3D Polar plot
There is always the need to look at your data in new and interesting ways. This is one thing we all know MATLAB is extremely good at doing! One area is plotting data in a polar plot. Central actually has a number of submissions, but the 3D version helps create some incredible surfaces.
There was a great PDF document for this file, but I could not find a simple example when I did help polar3D, so I will put one from that document here:
P = peaks(49)
Polar3d(-P,0,2*pi,100,400,1, ‘surf’)


Comments
To leave a comment, please click here to sign in to your MathWorks Account or create a new one.