Four Color Images
I recently attended a show at the Institute for Contemporary Art in Boston featuring work by Shepard Fairey. It got me thinking how simple it can be in MATLAB to make a 4-color image and adjust it however you like.
Contents
Import Image
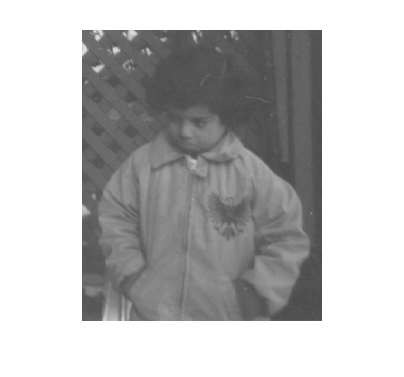
First, let me get an image. This one is a gray-scale image.
Ic = imread('pout.tif');
imshow(Ic)
Note: I am using imshow from Image Processing Toolbox to help manage the color and axes scaling.
Define Four Colors
Next let me choose a palette of colors, and display them.
lilac = [.5 .4 .9];
darkblue = [.1 .3 .8];
lightblue = [0 .5 .6];
red = [.8 0 0];
cm = [darkblue;  red; lightblue;  lilac];
image([1 3;2 4]),colormap(cm), axis off
Segment Gray Image into Four Levels
Next I choose levels for grouping pixel values into 4 color bins. The minimum and maximum values of my image are close enough to 0 and 255 to not bother stretching the range.
min(Ic(:))
max(Ic(:))
ans =
   74
ans =
  224
My first attempt at binning creates equal size bins.
levels = linspace(0,255,5)
levels =
            0        63.75        127.5       191.25          255
Next I create a new image by combining 4 binary images with the appropriate multipliers.
Idb = (Ic <= levels(2));
Ir = Ic<=levels(3) & Ic>levels(2);
Ilb = Ic<=levels(4) & Ic>levels(3);
Ipy = Ic<=levels(5) & Ic>levels(4);
Ic4 = Idb+2*Ir+3*Ilb+4*Ipy;
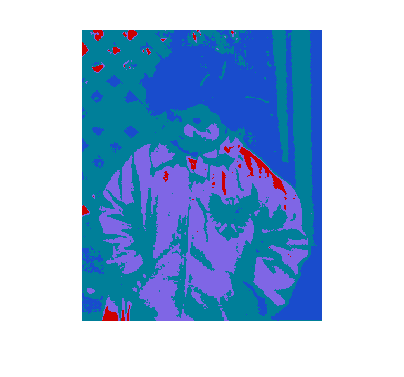
imshow(Ic4,cm)

Change the Order of Colors
What happens when I change the color order? Features appear different with different color selections.
cm = [darkblue;  lightblue;  lilac; red];
imshow(Ic4,cm)

Change Ranges for Four Colors to Bring Out Details
Now I finetune the color bins to emphasis more detail from the original image. I then recalculate the binary images according to the new bins and recombine them.
levels = [0 90 128 155 255]
Idb = (Ic <= levels(2));
Ir = Ic<=levels(3) & Ic>levels(2);
Ilb = Ic<=levels(4) & Ic>levels(3);
Ipy = Ic<=levels(5) & Ic>levels(4);
Ic4 = Idb+2*Ir+3*Ilb+4*Ipy;
imshow(Ic4,cm)
levels =
     0    90   128   155   255

Colormaps are Important
Choosing appropriate colormaps for displaying data is very important. You need to be careful to not exaggerate unimportant details. Here's an interesting reference from one of my geophysics periodicals.
A. Light & P.J. Bartlein, "The End of the Rainbow? Color Schemes for Improved Data Graphics," Eos,Vol. 85, No. 40, 5 October 2004.
Do you have any special colormaps you use for exploring or displaying your data? If so, can you post information (perhaps with links of plots to look at) here?
- 类别:
- Image Processing


评论
要发表评论,请点击 此处 登录到您的 MathWorks 帐户或创建一个新帐户。