lasso.m
Suppose you have a set of XY points. You plot them to see how they spread out. You decide a certain clump of points is special. How do you get MATLAB to know which points you care about? With lasso you can select them with your mouse!
To demonstrate I will use the sunspot example data that ships with MATLAB.
load sunspot.dat
[x,y,i] = lasso(sunspot(:,1),sunspot(:,2))
press a KEY to start selection by mouse, LEFT mouse button for selection, RIGHT button closes loop
x =
1836
1837
1848
1870
y =
121.5
138.3
124.7
139
i =
137
138
149
171


centroid = [mean(x) mean(y)]
centroid =
       1847.8       130.88
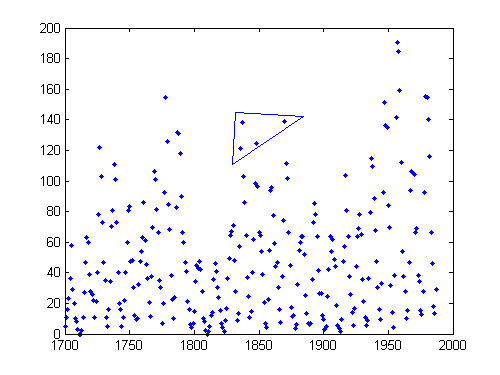
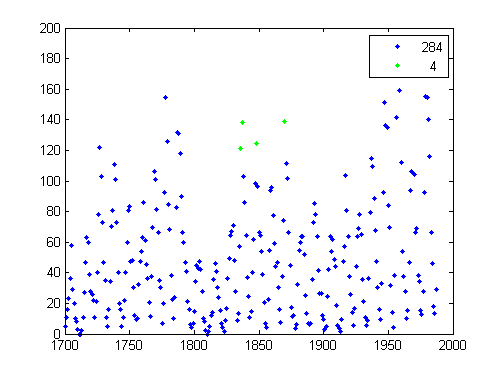
The program prompted me how to start and stop the selection. I left off the semicolon to show the values returned for further analysis (ie, centroid calculation). The first plot shows the polygon region I selected. The second plot shows the selected points with a free legend and point counter. Nice!
Note: if you like graphically interacting with your XY points be sure to check out Data Brushing introduced with R2008a.
- 类别:
- Picks


评论
要发表评论,请点击 此处 登录到您的 MathWorks 帐户或创建一个新帐户。