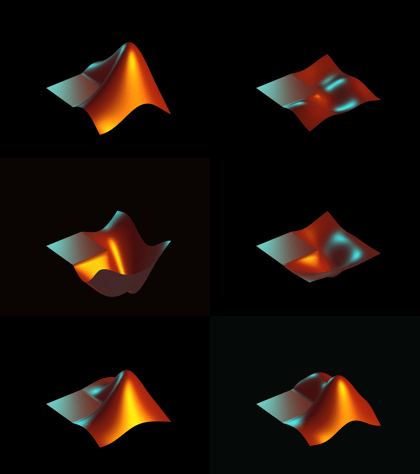
LUTBAR: A colormap tool to make your life easier
I don't know how many times I've spun my wheels, trying to determine the best colormap for a graphic I was working on, and cycling one-by-one through the built-in colormaps in MATLAB. MATLAB has many pre-defined colormaps, and selecting the best one can be a tedious process. At least, it was a tedious process. Us's LUTBAR tool streamlines the process by creating a toolbar of available colormaps; clicking on any entry automatically updates the figure's colorbar and allows you to see your figure in a variety of different colors. Better yet, LUTBAR automatically includes built-in colormaps, and enables you to include custom colormaps as well.
Let's say, for instance that you had this bit of code:
figure('color','w');
L = 40 * membrane(1,25);
x = -1:1/25:1;
s = surf(x,x',L,...
    'edgecolor','none',...
    'FaceLighting','phong', ...
    'AmbientStrength',0.3, ...
    'DiffuseStrength',0.6, ...
    'Clipping','off',...
    'BackFaceLighting','lit', ...
    'SpecularStrength',1.1, ...
    'SpecularColorReflectance',1, ...
    'SpecularExponent',7);
set(gca,'visible','off')
light('Position',[40 100 20], ...
    'Style','local', ...
    'Color',[0 0.8 0.8]);
light('Position',[.5 -1 .4], ...
    'Color',[0.8 0.8 0]);

Most of you will probably recognize the L-shaped membrane; it plays an interesting and important role at The MathWorks.(For the back story on our logo, check out Cleve's "History of MATLAB" video; it's just over 8 minutes, and well worth a watch!)
But you will also undoubtedly recognize that the coloring is "wrong." I could cycle manually (or even automatically) through the built-in colormaps:
mapOpts = {'autumn','bone','colorcube','cool',...
           'copper','flag','gray','hot','hsv',...
           'jet','lines','pink','prism','spring',...
           'summer','white','winter'};
for ii = 1:numel(mapOpts)
    set(gcf,'colormap',eval(mapOpts{ii}));
    pause(0.5);
end
Us gives us a cleaner, easier approach. All one has to do is issue the lutbar command:
lutbar

We now see a toolbar of selectable colormaps; clicking on any individual colormap icon updates the visualization. If you look with a careful eye, you might notice a separation line on the toolbar to the right of the (blue-to-green) 'winter' map. That line delimits the end of the built-in maps, and the beginning of a collection of user-defined maps. In fact, the last colormap on the toolbar is really just a uniform red colormap of my creation. Applying it yields the MathWorks logo we all know and love.
(Did you know that The MathWorks logo was uniformly colored, and that the apparent color gradations were created purely by manipulating the lighting?)
Us's code is beautifully implemented and documented; we've come to expect nothing less from him. Thanks for sharing this great function!
- 범주:
- Picks


댓글
댓글을 남기려면 링크 를 클릭하여 MathWorks 계정에 로그인하거나 계정을 새로 만드십시오.