Errorbar with Adjusted Tick Size
Jiro's pick this week is Errorbar with Adjusted Tick by Arnaud Laurent.
Just this week, I got a comment from Felipe on a guest post ("Making Pretty Graphs") that I did on Loren's blog. He pointed out this function by Arnaud that helps adjust the size of the horizontal ticks at the top and bottom of the errorbars that I had to fix manually in the post. Thanks Felipe for the tip!
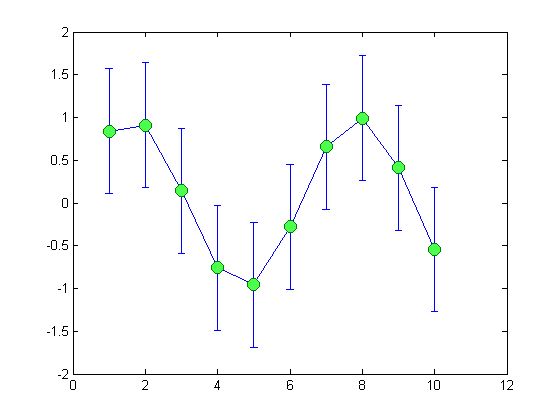
The errorbar automatically determines the tick size based on the limits of the axes, and there is no simple option to change that. However, the function can return a handle to errorbarseries, and you can modify the tick size by digging into its properties. That's what I did in my blog post. Now, it's even easier with Arnaud's errorbar_tick. I echo Felipe's comment on the entry page that it's nice how errorbar_tick works on the handle returned by the errorbar function, rather than recreating the functionality available in errorbar.
Create a standard errorbar plot:
x = 1:10;
y = sin(x);
e = std(y)*ones(size(x));
h = errorbar(x,y,e, 'o-');
set(h, 'MarkerSize', 10, 'MarkerFaceColor', [.3 1 .3], ...
    'MarkerEdgeColor', [0 .5 0]);

Apply errorbar_tick to increase tick size:
errorbar_tick(h, 30);

Comments
Let us know what you think here or leave a comment for Arnaud.
- 类别:
- Picks


评论
要发表评论,请点击 此处 登录到您的 MathWorks 帐户或创建一个新帐户。