Let It Snow!
Doug's pick this week is Let it snow by Mingjing Zhang.
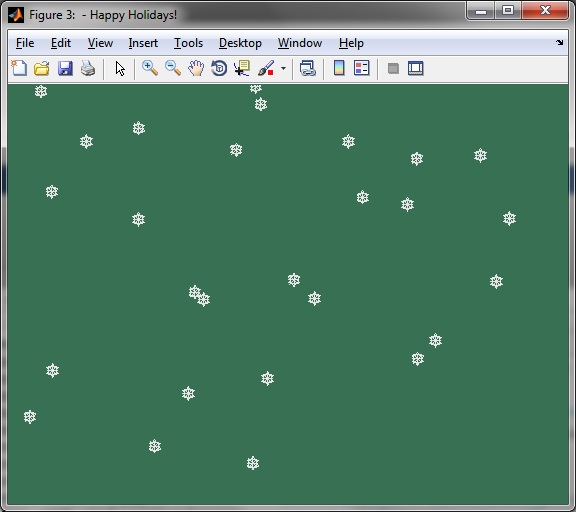
As some of you may know, MathWorks is headquartered just outside of Boston in a town called Natick. I lived in that area for 5 years, but I moved out to San Diego in 2007. There's a significant difference in climate out here so I like to keep track of the weather back in Boston just to see what I'm missing. I should probably use Trendy to help track the differences. I imagine the plot would look somewhat similar to the Anchorage/Honolulu comparison: So while I really don't have anything to complain about living in such a temperate place, I do sometimes miss the seasons, especially around this time of year. I noticed that this weekend they are getting a bit of a snowstorm back in Boston so I thought I'd turn to MATLAB to try to experience the excitement of seeing those big white flakes falling from the sky. That's when I found Mingjing's great submission that allows you to add some winter spirit to any MATLAB figure. You simply create a figure, then run letitsnow and soon a blizzard of snow is falling past the window.

I was impressed that Mingjing was able to create a snowflake image by cleverly stacking four standard plot markers (hexagon, x, cross, and square). This submission also serves as a good example of how to use a timer object with nested function callbacks to animate figures.
However when I first tried to run Mingjing's function in MATLAB R2012b, the snowflakes showed up only as squares. After turning on plot tools I noticed that only the square marker positions were being updated while the other three markers were stationary. It appears that when Mingjing calls refreshdata on line 149, it is only updating the last element of the plot handle vector that is passed in. I was able to work around this issue by updating line 149 to:
I also noticed that Mingjing's submission was inspired by a previous Pick, A christmas tree plot, so it seemed only natural to combine the two submissions together. I set the snow parameter in christmas.m to 0 and then ran:
Happy Holidays Everyone!
Comments
Let us know what you think here or leave a comment for Mingjing.
As some of you may know, MathWorks is headquartered just outside of Boston in a town called Natick. I lived in that area for 5 years, but I moved out to San Diego in 2007. There's a significant difference in climate out here so I like to keep track of the weather back in Boston just to see what I'm missing. I should probably use Trendy to help track the differences. I imagine the plot would look somewhat similar to the Anchorage/Honolulu comparison: So while I really don't have anything to complain about living in such a temperate place, I do sometimes miss the seasons, especially around this time of year. I noticed that this weekend they are getting a bit of a snowstorm back in Boston so I thought I'd turn to MATLAB to try to experience the excitement of seeing those big white flakes falling from the sky. That's when I found Mingjing's great submission that allows you to add some winter spirit to any MATLAB figure. You simply create a figure, then run letitsnow and soon a blizzard of snow is falling past the window.
figure('Color',[0.22 0.44 0.33])

letitsnow

I was impressed that Mingjing was able to create a snowflake image by cleverly stacking four standard plot markers (hexagon, x, cross, and square). This submission also serves as a good example of how to use a timer object with nested function callbacks to animate figures.
However when I first tried to run Mingjing's function in MATLAB R2012b, the snowflakes showed up only as squares. After turning on plot tools I noticed that only the square marker positions were being updated while the other three markers were stationary. It appears that when Mingjing calls refreshdata on line 149, it is only updating the last element of the plot handle vector that is passed in. I was able to work around this issue by updating line 149 to:
set(snow_plot_hdl,'XData',snowflakes_x,'YData',snowflakes_y)
I also noticed that Mingjing's submission was inspired by a previous Pick, A christmas tree plot, so it seemed only natural to combine the two submissions together. I set the snow parameter in christmas.m to 0 and then ran:
christmas

letitsnow

Happy Holidays Everyone!
Comments
Let us know what you think here or leave a comment for Mingjing.
- 범주:
- Picks


댓글
댓글을 남기려면 링크 를 클릭하여 MathWorks 계정에 로그인하거나 계정을 새로 만드십시오.