Downsampling polygons
Jiro's pick this week is Polygon simplification by Peter Bone.
Continuing from one of my recent posts on "Connecting points with smooth curves", I came across this new entry by Peter that would work nicely with the hobbysplines function in tracing objects.
Here's how I would use it. Let's start with the original amoeba image.
im = imread('amoeba.png');
imshow(im)

I'll convert this grayscale image to black and white, and use a function called bwboundaries from the Image Processing Toolbox to automatically trace out the boundaries.
im2 = im2bw(im);
boundaries = bwboundaries(~im2, 'noholes')
boundaries =
    [1696x2 double]
    [  30x2 double]
    [  33x2 double]
    [ 111x2 double]
    [  31x2 double]
    [  34x2 double]
Notice that bwboundaries returned a cell array of points for each boundary it found. In this case, it found 6 boundaries. For this discussion, I'll just focus on the largest boundary, i.e. the boundary with the most number of points. I can see that it is the first element. Question for everyone: how would I programmatically find the largest boundary? There are multiple ways of doing it, from basic MATLAB programming to advanced image processing. Post your response below.
largest = boundaries{1};
hold on
plot(largest(:,2),largest(:,1),'r','LineWidth',2)
hold off

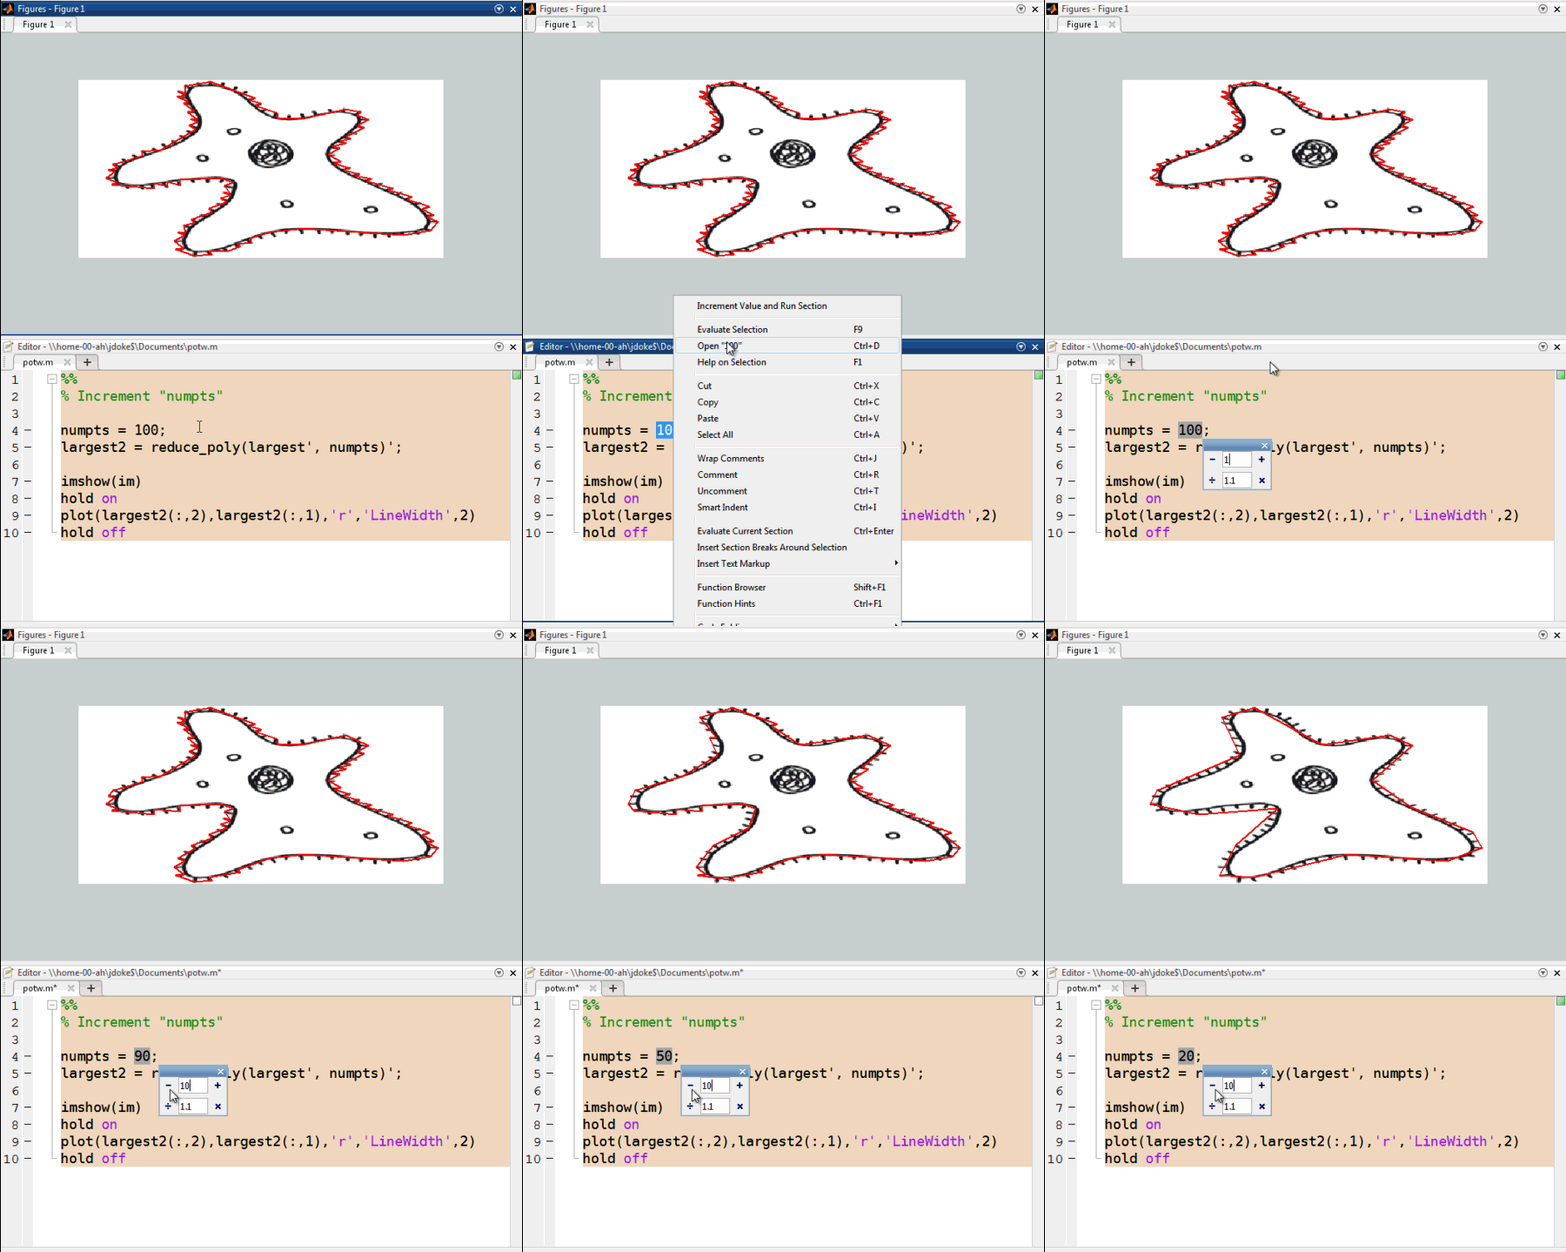
Now, suppose that I don't care for the details (e.g. the individual hairs) and would like to get just the general shape of the amoeba. I can do some filtering or smoothing of the data, or simply down-sample the boundary points. Peter's reduce_poly reduces the points by automatically removing the "least important" points. For example, I can ask for 100 points.
numpts = 100;
largest2 = reduce_poly(largest', numpts)';

imshow(im)
hold on
plot(largest2(:,2),largest2(:,1),'r','LineWidth',2)
hold off

That's better, but it's still too many points for my taste. I can modify numpts and rerun the block of code. Or, I can increment a value and run the section interactively.

I'll go with numpts = 20 for this case.
numpts = 20;
largest2 = reduce_poly(largest', numpts)';

imshow(im)
hold on
plot(largest2(:,2),largest2(:,1),'r','LineWidth',2)
hold off

Now, I'll use Will's hobbysplines to connect the points with smooth splines.
% Convert the boundary points to the format required by hobbysplines
pts = fliplr(largest2(1:end-1,:));

imshow(im)
hobbysplines(num2cell(pts,2), ...
    'linestyle',{'linewidth',2}, ...
    'color','red');

Comments
Let us know what you think here or leave a comment for Peter.
- 범주:
- Picks


댓글
댓글을 남기려면 링크 를 클릭하여 MathWorks 계정에 로그인하거나 계정을 새로 만드십시오.