Debugging Simulink Coder Executable Easily in R2013b
A few days ago I was showing a user how to debug an executable generated by Simulink Coder and I realized that the new Toolchain approach in R2013b makes this process a lot easier.
Let's see how to debug Simulink Coder executables in R2013b.
The Problem
If you want to debug an executable, you need debugging information. For example, when using Microsoft Visual Studio, this information is stored in a Program Database, a file with a .pdb extension.
For this .pdb file to be generated, you need to pass specific flags to the compiler.
For many releases, when I needed to debug a Simulink Coder executable, my workflow was to generate code , open the makefile, search for this line of code:

change the value to 1, and execute the .bat file to build the executable.
I have to admit, this process was not very efficient and had to be repeated every time your regenerated code, because the modified makefile would get overwritten. Of course, there were ways to automate some part of this workflow, but that required some pretty advanced knowledge of Simulink.
The R2013b workflow
In R2013b, enabling debugging can now be made directly from the Simulink interface. No more need to be a master hacker!
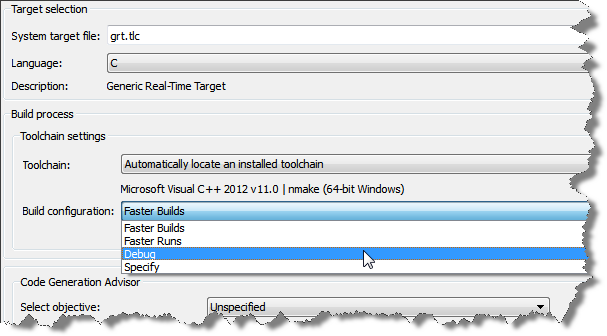
All you need to do is set the Build configuration option to Debug in the code generation section of the model configuration.

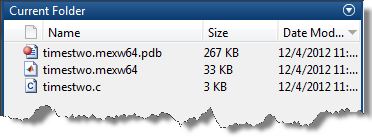
Build your model and a .pdb file will appear in your current directory along with the executable.

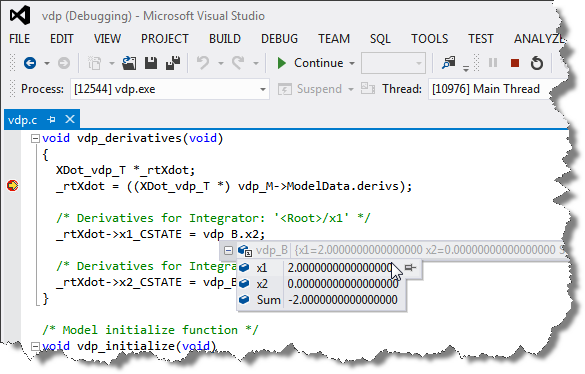
In Visual Studio, go to File -> Open -> Project/Solution and select the executable. Open the source code you want to debug, set breakpoints and click the Start Debugging button.

Now it's your turn
Let us know what you think of this new enhancement in R2013b by leaving a comment here.
- Category:
- Code Generation,
- Debugging


Comments
To leave a comment, please click here to sign in to your MathWorks Account or create a new one.