 Cleve’s Corner: Cleve Moler on Mathematics and Computing
 The MATLAB Blog
 Guy on Simulink
 MATLAB Community
 Artificial Intelligence
 Developer Zone
 Stuart’s MATLAB Videos
 Behind the Headlines
 File Exchange Pick of the Week
 Hans on IoT
 Student Lounge
 MATLAB ユーザーコミュニティー
 Startups, Accelerators, & Entrepreneurs
 Autonomous Systems
 Quantitative Finance
 MATLAB Graphics and App Building
Gray-scale pixel values in image regions
Before I dive into today's topic, I want to invite you to come back to the MATLAB Central Blogs page in a couple of weeks. Look for something new to appear related to deep learning.
Earlier today, I was looking at recent image processing questions on MATLAB Answers, and I came across this question:
"Using regionprops to change intensity of blobs"
I thought to myself, "I bet I've written about something like before." It turns out that I have -- but it was more than ten years ago! It is ever-so-slightly possible that a couple of you have not been reading this blog that long, so I thought I would update the post for you today.
The function regionprops is very useful for measuring the properties of shapes in a binary image. There are documentation examples and product demos showing how to do this, and I've shown this function in action several times in this blog.
But sometimes I get questions about how to process pixel values in the "original" gray scale image. In other words, suppose your process is something like this:
- Segment gray scale image to get a binary image of objects
- Do something with the original gray scale pixel values corresponding to each blob in the binary image
This post is about how to do that last step. Let's start by creating some simple sample images to work with.
I = imread('coins.png');
imshow(I)

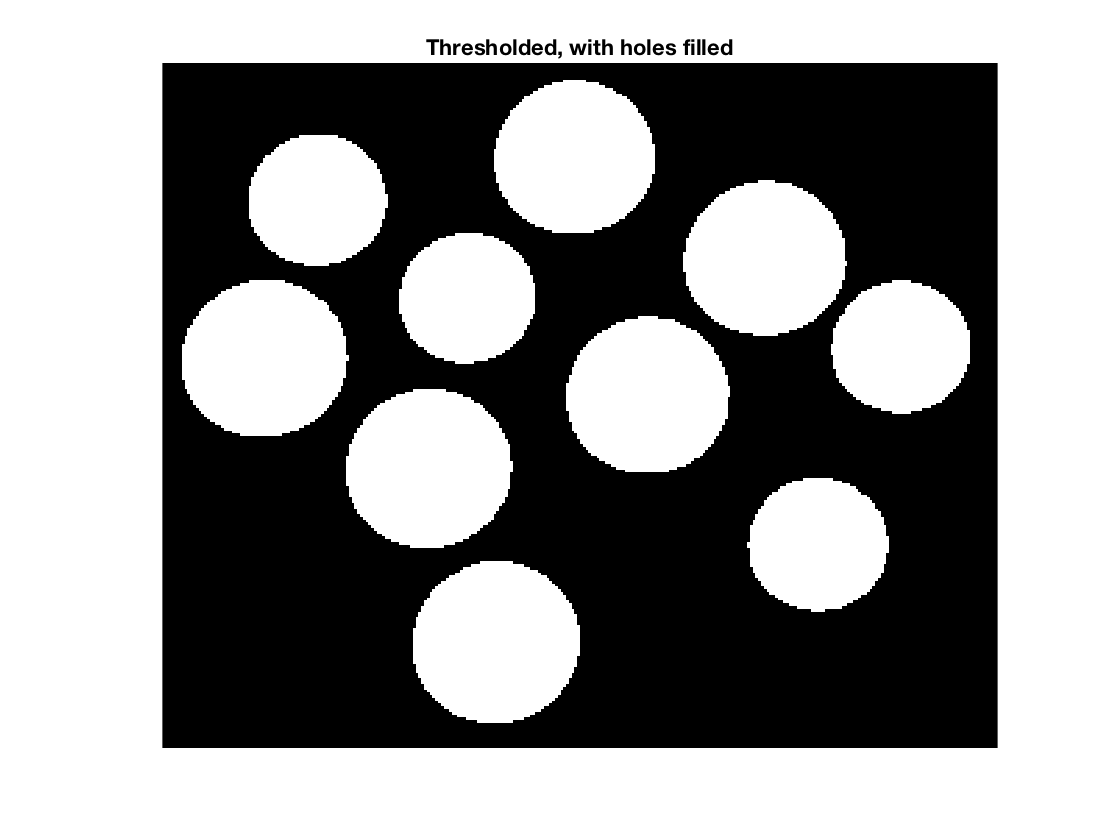
bw = imbinarize(I);
bw = imfill(bw, 'holes');
imshow(bw)
title('Thresholded, with holes filled')
The key to processing the pixels in I using the blobs in bw is to use regionprops to get the 'PixelIdxList' for each blob.
s = regionprops(L, 'PixelIdxList')
s =

  10×1 struct array with fields:

    PixelIdxList
s(1)
ans =

  struct with fields:

    PixelIdxList: [2651×1 double]
s is a struct array. s(k).PixelIdxList is a vector of the linear indices of the k-th region. You can use these values to index directly into I. For example, here is the mean pixel value of the 3rd coin:
idx = s(3).PixelIdxList;
mean(I(idx))
ans =

  172.8769
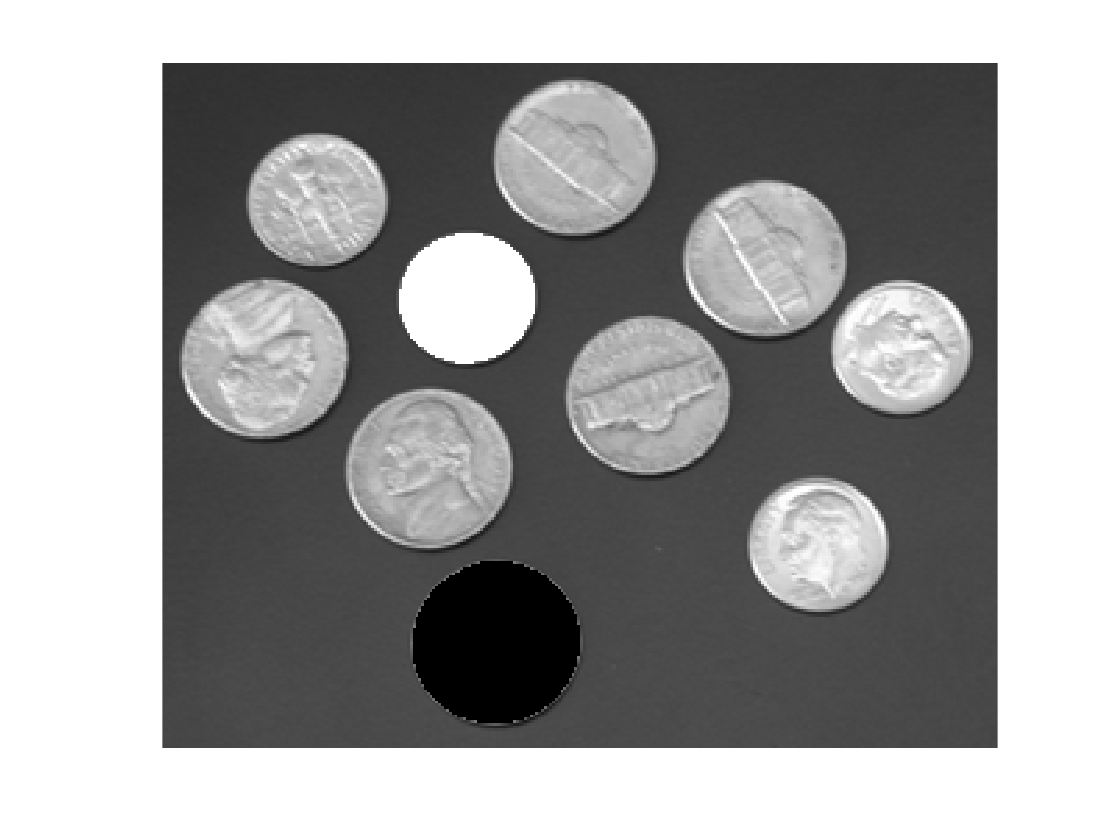
You can also replace object pixel values in I by indexing on the left side of an assignment statement, like this:
% Turn the 4th coin white and the 5th coin black:
J = I;
J(s(4).PixelIdxList) = 255;
J(s(5).PixelIdxList) = 0;
imshow(J)
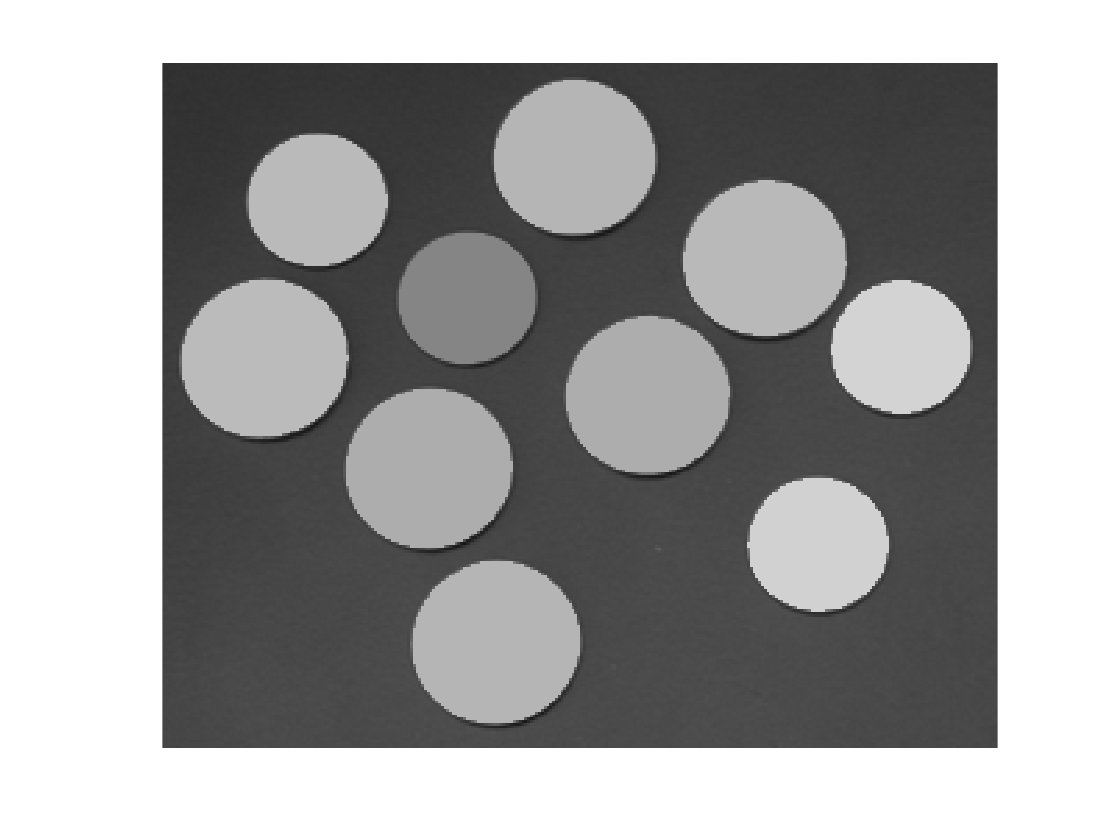
Here's a loop that replaces the pixel values for each coin by the mean pixel value for that coin:
F = I;
for k = 1:numel(s)
    idx = s(k).PixelIdxList;
    F(idx) = mean(I(idx));
end
imshow(F)
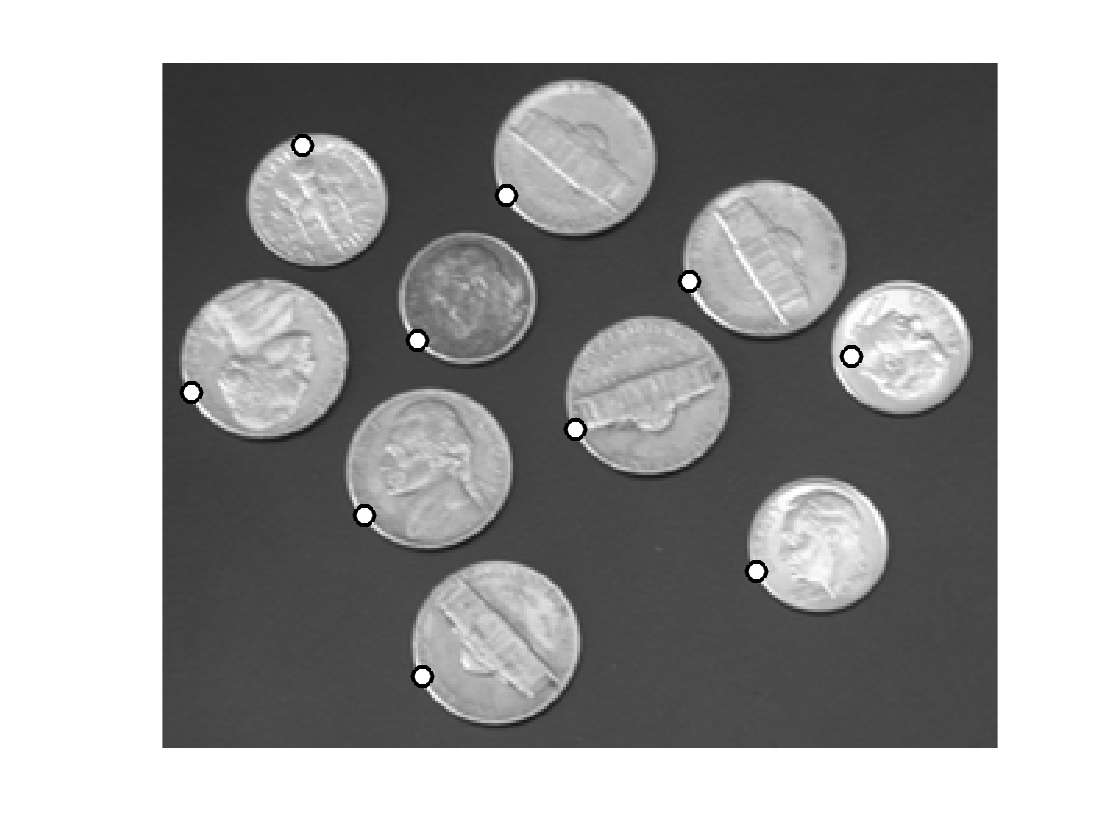
I'll finish with a question that Mat asked in a blog comment: "How can I find the location of the maximum pixel value in each labeled region?" Here's how to find the locations and then plot them on top of the original image. (In addition to 'PixelIdxList', I'll also ask regionprops for 'PixelList', which gives the x and y coordinates of each pixel in the region.)
s = regionprops(L, 'PixelIdxList', 'PixelList');
imshow(I)
hold on
for k = 1:numel(s)
    idx = s(k).PixelIdxList;
    pixels_in_region_k = I(idx);
    [max_value, max_idx] = max(pixels_in_region_k);
    max_location = s(k).PixelList(max_idx, :);
    plot(max_location(1),max_location(2),'o','MarkerSize',10,...
        'MarkerFaceColor','w','MarkerEdgeColor','k')
end
hold off


Comments
To leave a comment, please click here to sign in to your MathWorks Account or create a new one.