One of MATLAB's features is being able to customize plots. But some of the customization may not need to be done by hand and can instead be controlled programmatically. Let me show you a set of these having to do with plotting lines.
Contents
Plotting by Adding Lines
If you make a plot by successively adding lines, all the lines, by default, have the same color and linestyle.
m3 = magic(3); plot(m3(:,1)); hold on plot(m3(:,2)) plot(m3(:,3)) hold off
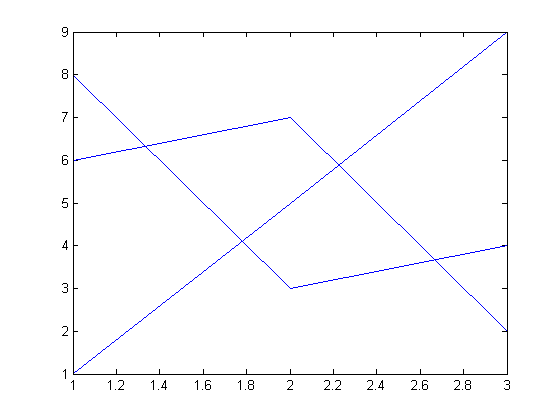
As you can see, it's very hard (impossible) to tell which line is which.
Manually Control Color and Style
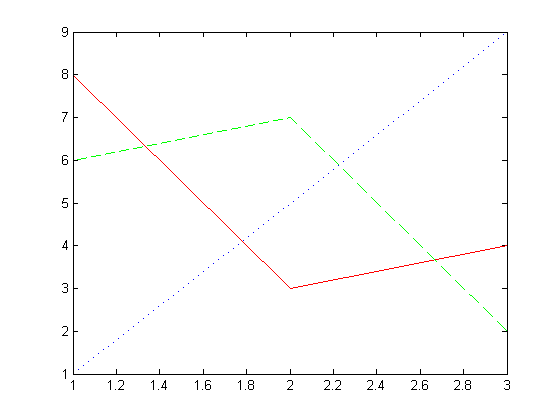
I can distinguish the lines by using different colors and linestyles. Here's one way to do it.
plot(m3(:,1),'r'); hold on plot(m3(:,2),':b') plot(m3(:,3),'g--') hold off
Vectorizing Line Drawing
I can instead vectorize the line drawing.
plot(m3)
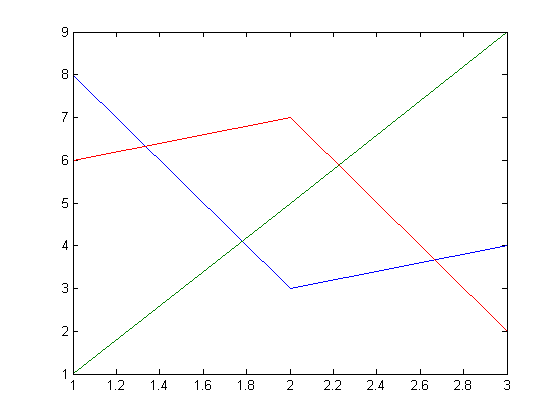
What you see here is the MATLAB cycles through colors to distinguish the plots. How many colors and which ones? Does MATLAB ever cycle through the linestyles? You can find out answers to these questions in the documentation on LineStyle and Color as well as some answers in this article.
Default Line Properties
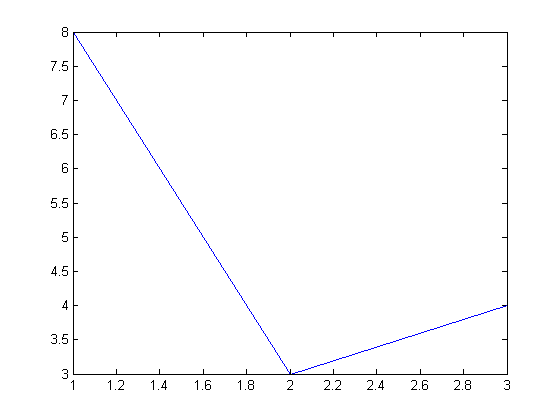
Let's see what properties lines in MATLAB have. First I'll create a line and then get the properties.
h = plot(m3(:,1)); get(h)
DisplayName: ''
Annotation: [1x1 hg.Annotation]
Color: [0 0 1]
EraseMode: 'normal'
LineStyle: '-'
LineWidth: 0.5000
Marker: 'none'
MarkerSize: 6
MarkerEdgeColor: 'auto'
MarkerFaceColor: 'none'
XData: [1 2 3]
YData: [8 3 4]
ZData: [1x0 double]
BeingDeleted: 'off'
ButtonDownFcn: []
Children: [0x1 double]
Clipping: 'on'
CreateFcn: []
DeleteFcn: []
BusyAction: 'queue'
HandleVisibility: 'on'
HitTest: 'on'
Interruptible: 'on'
Selected: 'off'
SelectionHighlight: 'on'
Tag: ''
Type: 'line'
UIContextMenu: []
UserData: []
Visible: 'on'
Parent: 161.0015
XDataMode: 'auto'
XDataSource: ''
YDataSource: ''
ZDataSource: ''
To see what the default properties are, I can use set instead of get.
set(h)
ans =
DisplayName: {}
Color: {}
EraseMode: {4x1 cell}
LineStyle: {5x1 cell}
LineWidth: {}
Marker: {14x1 cell}
MarkerSize: {}
MarkerEdgeColor: {2x1 cell}
MarkerFaceColor: {2x1 cell}
XData: {}
YData: {}
ZData: {}
ButtonDownFcn: {}
Children: {}
Clipping: {2x1 cell}
CreateFcn: {}
DeleteFcn: {}
BusyAction: {2x1 cell}
HandleVisibility: {3x1 cell}
HitTest: {2x1 cell}
Interruptible: {2x1 cell}
Selected: {2x1 cell}
SelectionHighlight: {2x1 cell}
Tag: {}
UIContextMenu: {}
UserData: {}
Visible: {2x1 cell}
Parent: {}
XDataMode: {2x1 cell}
XDataSource: {}
YDataSource: {}
ZDataSource: {}
Notice two particular properties, Color and LineStyle. get shows me the current values.
get(h,'Color')ans =
0 0 1
set allows me to see the choices for that property.
set(h,'LineStyle')[ {-} | -- | : | -. | none ]
How Do axes Fit in?
Each line has a color and a linestyle, and they each have defaults, so what determines the behavior when I plotted multiple lines and got different colors? That's related to a property of axes which we can see here.
get(gca)
ActivePositionProperty = outerposition ALim = [0 1] ALimMode = auto AmbientLightColor = [1 1 1] Box = on CameraPosition = [2 5.5 17.3205] CameraPositionMode = auto CameraTarget = [2 5.5 0] CameraTargetMode = auto CameraUpVector = [0 1 0] CameraUpVectorMode = auto CameraViewAngle = [6.60861] CameraViewAngleMode = auto CLim = [0 1] CLimMode = auto Color = [1 1 1] CurrentPoint = [ (2 by 3) double array] ColorOrder = [ (7 by 3) double array] DataAspectRatio = [1 2.5 1] DataAspectRatioMode = auto DrawMode = normal FontAngle = normal FontName = Helvetica FontSize = [10] FontUnits = points FontWeight = normal GridLineStyle = : Layer = bottom LineStyleOrder = - LineWidth = [0.5] MinorGridLineStyle = : NextPlot = replace OuterPosition = [0 0 1 1] PlotBoxAspectRatio = [1 1 1] PlotBoxAspectRatioMode = auto Projection = orthographic Position = [0.13 0.11 0.775 0.815] TickLength = [0.01 0.025] TickDir = in TickDirMode = auto TightInset = [0.0392857 0.0404762 0.00892857 0.0190476] Title = [166.002] Units = normalized View = [0 90] XColor = [0 0 0] XDir = normal XGrid = off XLabel = [163.002] XAxisLocation = bottom XLim = [1 3] XLimMode = auto XMinorGrid = off XMinorTick = off XScale = linear XTick = [ (1 by 11) double array] XTickLabel = [ (11 by 3) char array] XTickLabelMode = auto XTickMode = auto YColor = [0 0 0] YDir = normal YGrid = off YLabel = [164.002] YAxisLocation = left YLim = [3 8] YLimMode = auto YMinorGrid = off YMinorTick = off YScale = linear YTick = [ (1 by 11) double array] YTickLabel = [ (11 by 3) char array] YTickLabelMode = auto YTickMode = auto ZColor = [0 0 0] ZDir = normal ZGrid = off ZLabel = [165.002] ZLim = [-1 1] ZLimMode = auto ZMinorGrid = off ZMinorTick = off ZScale = linear ZTick = [-1 0 1] ZTickLabel = ZTickLabelMode = auto ZTickMode = auto BeingDeleted = off ButtonDownFcn = Children = [162.004] Clipping = on CreateFcn = DeleteFcn = BusyAction = queue HandleVisibility = on HitTest = on Interruptible = on Parent = [1] Selected = off SelectionHighlight = on Tag = Type = axes UIContextMenu = [] UserData = [] Visible = on
Well, hmmmm -- so many properties. Let me point out the two that are the ones to focus on for now.
get(gca,'ColorOrder')ans =
0 0 1.0000
0 0.5000 0
1.0000 0 0
0 0.7500 0.7500
0.7500 0 0.7500
0.7500 0.7500 0
0.2500 0.2500 0.2500
get(gca,'LineStyleOrder')ans = -
Note: using gca is really only for debugging or illustration. Normally a handle should be gotten from the chosen axes and that handle specifically should be used.
axes Properties ColorOrder and LineStyleOrder
There are two axes properties that you can set to help you make the lines in your plots follow a pattern of color and linestyle. To see how these work, let's set the defaults for these properties at the root of the handle graphics hierarchy and experiment.
set(0,'DefaultAxesLineStyleOrder',{'--',':'}) set(0,'DefaultAxesColorOrder',[1 0 1; 0 1 1; 0 1 0]) yvals = [1:10;1:10] plot(yvals) axis([1 2 0 size(yvals,2)+1 ])
yvals =
1 2 3 4 5 6 7 8 9 10
1 2 3 4 5 6 7 8 9 10
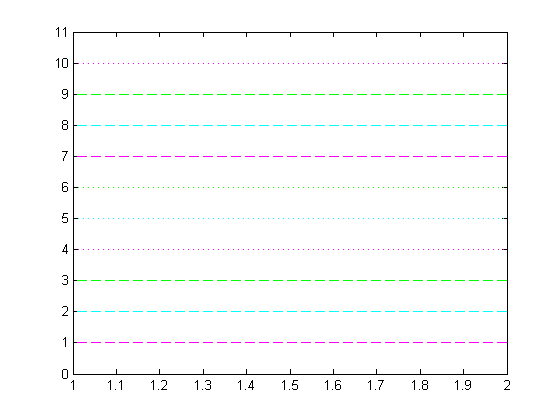
Now you see that MATLAB first cycles over the colors using the first linestyle, then again cycles over the colors with the second linestyle, etc., eventually cycling over the linestyles again as well.
Do You Override the Defaults?
Do you override the line plotting defaults? Do you do this manually or by setting the defaults as I have shown here? Let me know here how you avoid hand-updating your plots.
Get
the MATLAB code
Published with MATLAB® 7.5


Nice tips Loren. Some useful tips that I didn’t know. The ‘ColorOrder’ is extremely useful as I sometimes plot over 10 curves on the same plot and this is a good way to set the curves to different colors automatically.
Cool feature — thanks for the tip! I’ll definitely use overriding ColorOrder when I start making plots again for my thesis. I make a lot of different plots when I collect data, so any kind of automation would make my scripts shorter and easier to understand. It’s also nice to be able to set the default colors so as to avoid the lighter colors (like yellow) that are too difficult to see on an overhead slide, or in case I want to send plots to my color-blind colleague (then I can override the default colors so as to avoid red).
I usually get rid of the line colours and use only line styles. That way I can distinguish between the curves when printing them on a B/W printer as well. I do this in the initialisation script that I have in every project I work with that sets paths and plotting styles.
Now, in the documentation there is a comment that in a B/W environent, Matlab will automagically ignore the color styles and only cyckle through the line styles, but I have yet to see this in practice. Is there a way to indicate for matlab that it is in fact working in a B/W environment, for example when printing?
When plotting one line at a time rather than all at once, I usually achieve a similar effect with “jet” or “hsv”:
x = 1:5;
N=12;
colors = jet(N);
figure(1);clf;
for i = 1:N
y = x*i; % some big calculation
figure(1); hold on; plot(x,y,’Color’,colors(i,:));
end
Thanks, Loren. I produce graphs pretty often but I was not aware of these *Order properties. Pretty handy!
Similarly to Daniel, I often need to produce graphs for B/W environment. To be honest, 4 line styles is not much, I would be thankful for more of them (moreover, when exporting to EPS, the dotted style is not very usable).
I often use combinations of line styles and markers to create higher number of ‘line styles’. Regarding to that, I have several questions (or feature requests):
1] Can the marker be included in the ‘LinestyleOrder’? Or is there also something like ‘MarkerOrder’?
2] Could we somehow define our own line styles? For example by ‘-..’, ‘-.-..’, ‘–.’, or any other reasonable way?
3] Regarding the markers: sometimes I plot e.g. 2 lines. One of them is defined by sparse data points (e.g. only by 2), the second one is defined by dense data points (e.g. by 1000), but the range of the curves is the same, e.g. 0..1. If I want to distinguish them just by marker, I can use ‘x-’ and ‘o-’. The problem is the density: 2 ‘x’s on the first line, 1000 ‘o’s on the second line. Is there a way to say that I do not want the markers to actually mark the defining data points, but rather just distinguish the two lines, i.e. to be part of the line style, and to be plotted in equidistant places, e.g. in multiples of 0.1?
At present, I do that by hand (subsample or interpolate the lines to add the markers to the lines), but then there are some problems with adding the legend…
Thanks for your suggestions.
Thanks for all the comments.
I believe the comment about the documentation saying something about a black and white environment, that at least used to be true. My question for you is, what exactly is your setup for a black and white environment? My guess is that there is really color still implicitly there and so MATLAB is avoiding it. It seems like that was much more (for screens, not hardcopy) a thing of the past.
Markers can’t be included in LineStyleOrder (as far as I know) and there is no way for users to define your own linestyles. I know at least the latter is a much requested feature on the list.
And I know of no special way to reduce the number of markers except to plot a subset, as you noted.
–Loren
Hi Loren!
Is there a way to redefine the colors I get with ‘b’, ‘r’, ‘g’, ‘y’, ‘m’ and so on, for example by typing “plot(x, y, ‘g’)”? I personally don’t like the standard green as it is very light, and the standard yellow is hardly visible in presentations with a beamer. I would like to change them to a dark green and to something between yellow and orange.
Regards
Markus
I would like to second the request for an ability to create your own markers. I think an easy solution would be to allow the use of any character in a font as a marker. I currently emulate this by using the text() command.
Hi Loren,
I greatly enjoy reading your blog. Not being a native computer scientist it took me while to get used to functions, but once that happened I started functionalizing everything, including plotting assignments. It looks like this:
function [LS,LC,MSH,MFC,MEC,MS] = colorshape(i,FACS,COLORMAP)
%FACS measurement yes/no?
%Also colormap jet defined with step through size of 4
colors = colormap(COLORMAP);
FACS_set = exist(’FACS’,'var’);
colorvector = {’k',’b',’r',’g',’cyan’,'orange’,'magenta’,'yellow’,'yellow’,'b’,'r’,'g’,'cyan’,'orange’,'magenta’,'k’};
shapevector = {’o',’s’,'d’,'^’,'v’,”,’p',’o',’s’,'d’,'^’,'v’,”,”};
if FACS == 0
j=i*4;
MS = 10;
LS = ‘-’;
%LC = colors(j,:);
LC = char(colorvector(i));
MSH = char(shapevector(i));
%MFC = char(colorvector(i));
MFC = colors(j,:);
MEC = char(colorvector(1));
end
Depending on what I want to plot, I use the set colors or cycle through a colormap with a defined stepsize. MarkerFaceColors and shapes are also set.
Cheers
Mike
Markus-
There is no way to redefine the predefined colors. You need to use rgb triplets instead.
–Loren
Hi Loren,
At Kodak, virtually all data sets that represent color (and there are a lot of them!)use the traditional RGB order so everyone there has (or should have) a startup file that changes the ColorOrder appropriately. Otherwise you get a blue line representing the red data, etc. It can be confusing. Kodakers and other users of color data beware!
Doug
Loren: Yes, we need more line styles!
Petr: Check out the Dec. 11 “Making Pretty Graphs” post on getting a dotted line to look good in exported eps files. The package fixPSlinestyle really helps.
It is sometimes useful to use the Export Setup GUI where you can set the colorspace to black and white and select “convert solid lines to cycle through line styles”. This is more of an afterthought if I forget to set these things in the code.
Thanks, all!
Petr,
Here’s a way to make your sparse-interval marker plotting to work with the legend:
%%%%%%%%%%%%%%%%%%%%%%%%%%%
% original signal
x = 0:.01:1;
y = sin(6*x);
% decimated signal
x2 = linspace(0,1,20);
y2 = sin(6*x2);
% add dummy plot object at the beginning
h = plot(NaN,NaN,’b-*’,x,y,’b-’,x2,y2,’*');
legend(h(1),’signal’);
%%%%%%%%%%%%%%%%%%%%%%%%%%%
The first line (NaN, NaN) is used for the legend. It’s a hack but it works.
Here’s a newsgroup thread from a while ago:
http://www.mathworks.com/matlabcentral/newsreader/view_thread/136381
Also remember that “hold all” will allow you to make subsequent plots that automatically cycle through the colors and line styles:
x = 1:10;
figure;
hold all;
for id = 1:8
plot(x, id*x)
end
On some plots I create my own sequence of markers. Either a separate MarkerOrder property or including markers in LineStyleOrder would be useful.
Also, markers have two colors, MarkerEdgeColor and MarkerFaceColor. For 2D and 3D plots of spectra, where the wavelength/frequency is not one of the axis, I plot the long and short wavelength extreme points as subsets,and use MarkerFaceColor to make them red and blue.
Over 10 years ago, there was some discussion of adding user-defined line styles, but nothing ever came of it. I’d like to be able to define a line style via a length-2 cell array {L M}, where L is a double that specifies the length per line element, and M is either a string of 0’s and 1’s or an unsigned 16-bit integer that encodes the line pattern. Each bit of the integer or each character of the string would specify whether the corresponding line element is to be drawn. Here are some examples:
{0.01 ‘01′} would produce very short dashes, with the dashes and spaces having equal length.
{0.03 ‘01′} would produce longer dashes, with the dashes and spaces still having equal length.
{0.01 ‘0001′} would produce very short dashes, with the spaces between the dashes being three times as long as the dashes.
Loren,
Your suggestions make a lot of sense, and I have modified my figures in the past using these means for publication. However, I was still not happy: I would like to change the defaults that Matlab uses for figures and axes. In other words, set the defaults once, and when you say “figure” you will get the correct colors, fonts (name, slant, size), tick directions, in other words all the settings will be to your satisfaction.
Here is what I found out would work. The reason it took me a while to figure it out is that it uses undocumented properties of the root (I wonder exactly why they are undocumented?). I put this into a script that I run whenever I need the figures to look a certain way:
set(0, ‘DefaultFigureColor’, ‘White’, …
‘DefaultFigurePaperType’, ‘a4letter’, …
‘DefaultAxesColor’, ‘white’, …
‘DefaultAxesDrawmode’, ‘fast’, …
‘DefaultAxesFontUnits’, ‘points’, …
‘DefaultAxesFontSize’, 14, …
‘DefaultAxesFontAngle’, ‘Italic’, …
‘DefaultAxesFontName’, ‘Times’, …
‘DefaultAxesGridLineStyle’, ‘:’, …
‘DefaultAxesInterruptible’, ‘on’, …
‘DefaultAxesLayer’, ‘Bottom’, …
‘DefaultAxesNextPlot’, ‘replace’, …
‘DefaultAxesUnits’, ‘normalized’, …
‘DefaultAxesXcolor’, [0, 0, 0], …
‘DefaultAxesYcolor’, [0, 0, 0], …
‘DefaultAxesZcolor’, [0, 0, 0], …
‘DefaultAxesVisible’, ‘on’, …
‘DefaultLineColor’, ‘Red’, …
‘DefaultLineLineStyle’, ‘-’, …
‘DefaultLineLineWidth’, 2, …
‘DefaultLineMarker’, ‘none’, …
‘DefaultLineMarkerSize’, 8, …
‘DefaultTextColor’, [0, 0, 0], …
‘DefaultTextFontUnits’, ‘Points’, …
‘DefaultTextFontSize’, 14, …
‘DefaultTextFontName’, ‘Times’, …
‘DefaultTextVerticalAlignment’, ‘middle’, …
‘DefaultTextHorizontalAlignment’, ‘left’);
Regards,
Petr
%% Why doesn’t work these code??
clear
close all
LSO = {’-';’–’;':’;'-.’};
x = repmat([1:45],3,1);
figure;
ax = axes;
set(ax, ‘LineStyleOrder’,LSO)
plot(ax, x)
legend show
%% But these??
figure
ax2 = axes;
set(0,’DefaultAxesLineStyleOrder’,LSO)
plot(ax, x)
legend show
% Restore the old Default value…
set(0,’DefaultAxesLineStyleOrder’,'-’)
%% :’-(
JR-
You need to use
before the plot statement. plot basically calls newplot which resets the axes state back to the old settings.
–Loren
I like Phillip Feldman’s idea of user-configurable line types, but instead of his scheme I propose specifying a vector of “on” and “off” lengths.
Phillip’s {0.01 ‘01′} would be encoded as [0.01 0.01].
{0.03 ‘01′} would be encoded as [0.03 0.03].
{0.01 ‘0001′} would be encoded as [0.03 0.01].
This would allow us to define more complicated patterns and non-integral relationships such as [0.01 0.03 0.025 0.05].
Doug
As a longtime user of Matlab, the restriction of only 4 line style really let me down. I am working on a serious publication which would require using only black-write print. So we are crying for more line style, if not user-defined at this moment.
Also similar to the density of markers, the spacing of dashed line — varies with the side of your dataset. If I have a long datalist, instead of getting dashed line of higher resolution, I get sth. not so distinguishable with the solid line. As line style is just need to tell apart different lines, user should better have option to change how these dashes appear to be.
Petr,
The setting of default figure/axes/etc properties is documented:
http://www.mathworks.com/access/helpdesk/help/techdoc/creating_plots/f7-21465.html
jiro
Thank’s a lot Loren!!!
I was surprised about it… but now it work’s!
;-Þ
Response to Gang Wang:
I’ve had your problem too and in colaboration with my Redactor we found these solution: if you use (for example) these settings for 6 lines:
set(h(1:6) , …
‘LineWidth’,2 , …
{’LineStyle’},{’-';’-';’-';’–’;'–’;'–’} , …
{’Color’},{[0 0 0];[0 1 0];[1 0.6 0];[1 0 0];[0 0 1];[0 0 0]})
you can recognize the plot pretty good on a grey-scala graphic about 10×5cm (~4″x2″). Note: normaly you must take care about the ‘XTick’ and the ‘YTick’ properties.
Best Rergads!
J.R.!
The automatic color/style changing is really nice. but i would really like it also to work when hold is on. I dont want all these lines to be blue:
m3 = magic(3);
plot(m3(:,1));
hold on
plot(m3(:,2))
plot(m3(:,3))
hold off
I dont change defaultcolororder and linestyle. But i have changed the default colormap in my startup file. The default colormap is no good for colorblind, so i’ve made my own: darkblue:blue:cyan:white:yellow:red:darkred. I think you should include such a colormap in your predefined list. Also the colormap function could take some more arguments. Some examples:
colormap(’jet’,'reverse’)
colormap(’darkblue:blue:cyan:white:yellow:red:darkred’)
colormap(’jet’,’stretchscale’,@(x)tanh((x-.5)*5));
Lots of possibilities. the last one is maybe a bit over the top, but i find myself doing non-linear transformations of the colorscale quite often, if i want to bring out some specific features in an image. (sorry about going a bit off topic.)
To Petr Pošík :
I’ve made a small wrapper to matlabs print command. When you export to an eps file then my code is afterwards modifying all dotted lines. It looks much better in my opinion. It is called “savefigure.m” and is on matlabcentrals fileexchange.
@aslak grinsted,
You can use “hold all” to use the color/style order for subsequent plots:
m3 = magic(3);
plot(m3(:,1));
hold all
plot(m3(:,2))
plot(m3(:,3))
hold off
jiro
When i use the instruction rectangle to plot a rectangle or a cirlce the attributes i know are: position, curvature and facecolor. Es: rectangle(’position’,[20,55,15,15],’curvature’,[1,1],’FaceColor’,'r’);
The border il always black. Is possible to use an atribute to set the color of the border?
Andrew,
‘rectangle’ object has many more properties you can set, such as ‘EdgeColor’:
h = rectangle(’position’,[20,55,15,15],…
‘curvature’,[1,1], …
‘FaceColor’,'r’, …
‘EdgeColor’, ‘r’);
Type “get(h)” and it will show you other attributes of the object.
jiro
Hi Loren,
I’ve a problem of converting a ring shaped image portion to a rectangular strip dimension. Plz help..
Tina-
This question is off-topic.
You could consider texture mapping or transforming a grid. There is information in the documentation. Also consider contacting technical support.
–Loren
jiro,
thanks for the sparse marker + line legend hack.
the nan wasn’t good for me this time because i was using a single plot command for multiple plot lines, embedded in another function, and it was too much hassle to enable… will remember the trick for next time, though!
sarah
Hi Loren,
I’m trying to figure out how to fit images to all available space in plots (imshow command) - so much space is wasted when using imshow due to the unused axis areas
I’ve tried: set(gcf,’ActivePositionProperty’,'OuterPosition’)
but had no luck.
If this is possible could you shed some light on hoe to do this?
Thanks,
JS
JS, it’s not clear exactly what problem you are encountering. There are many possibilities. Can you please share a code snippet that reproduces the problem using - ideally - an example image that ships with MATLAB? Thanks!
Hi Bob, thanks for replying.
When using the imshow command it creates a plot that has wide gray borders around the picture. I’d like pictures occupy all the plot area, i.e., expand the picture to totally fit the plot area
Thanks, JS
Hi JS, Just use the command iptsetpref(’ImshowBorder’, ‘tight’) before you call imshow. — Rob
Hey Rob!
Thanks!! Fantastic, this had me going nuts!!!
Thank you so much, JS
JS - You can also call IMSHOW with the ‘Border’ option set to ‘tight’ like this:
imshow(I,’Border’,'tight’)
This controls the border for that particular call to IMSHOW. The technique Rob suggests sets it as a preference which persists until you change the preference or quit and restart MATLAB.
Mara
Hi Rob/Mara.
Thanks so much for your replies, both suggestions are very helpful.
Not wanting to abuse your goodwill, is there a way to also eliminate the borders/axis when using imshow with the subplot command (does subplot creates its own border?)?
Again, thanks a million. JS
Hello,
I am running a psychophysics experiment with around 25 concurrent users in Matlab but have run into the following problem: With our institutional license, the Image Processing Toolbox only allows 7 concurrent users, while Matlab itself allows 30. This is clearly the result of a scheme by Mathworks to squeeze more US taxpayer-funded grant money out of researchers but nevertheless I am hoping to find a way to replicate the imshow command without using the toolbox. In particular, I would like to have the initial magnification of a 2 image subplot to work in a way akin to setting the InitMag parameter to ‘fit’ with imshow. Can this be done with imagesc for example? The images I want to display are all of different dimensions.
DG-
I suggest you work with technical support on this. imshow is not something I am up on the details about and I am more focused on the language aspects of MATLAB these days than the graphics.
–Loren
Hello,
In the spirit of user defined/additional linestyles, does anyone know how to define additional marker symbols to be read by a legend?
By using the text command you can plot letters or other symbols as if they were points on a graph, but legend doesn’t recognize them as data sets, any suggestions?
Thank you
Hi,
Great blog! …well I still have a question. Matlab does not allow to create more thant 4 line “styles” (note: I need to make plots ib black and white). Do you have plug in or some thing to create additional line styles,such as -., — etc.?
Shekhar
Shekhar-
MATLAB doesn’t currently support a way for users to add line styles.
You might check out the doc for linespec: http://www.mathworks.com/access/helpdesk/help/techdoc/ref/linespec.html
You could add markers to your lines perhaps. Or you might be able to simulate some other linestyles by plotting them on top of one another with different line widths.
–Loren
I have used the following code in conjunction with ‘hold all’ to give (num_copies) subsequent plots the same color.
%% start of code
original_order=get(0,’DefaultAxesColorOrder’);
new_order=transpose(reshape(transpose(repmat(original_order,1,num_copies)),size(original_order,2),num_copies*size(original_order,1)));
set(0,’DefaultAxesColorOrder’,new_order)
%% end of code
For instance, with matrices dataA and dataB for which rows of dataA are to be compared one-to-one with rows of dataB:
%%start of example code
num_copies=2;
original_order=get(0,’DefaultAxesColorOrder’);
new_order_T=transpose(reshape(transpose(repmat(original_order,1,num_copies)),size(original_order,2),num_copies*size(original_order,1)));
set(0,’DefaultAxesColorOrder’,new_order_T)
figure
hold all
for i=1:size(dataA,1)
plot(dataA(i,:),’-')
plot(dataB(i,:),’:')
end
set(0,’DefaultAxesColorOrder’,original_order) %%reset to the old color order
%% end of example code
will plot corresponding rows of A and B in the same color.
Hi Loren,
Thanks for this great blog!
I have a question that hopefully you can help me with:
I am doing several graphs in the same plot, by means of a “for” cycle” (10 graphs) and I would like the legend of my plot to be updated automatically with each loop of the code, or at the end of the cycle. For example, suppose that I have the following code:
%%example
vals = [0 10 20 30];
x = linspace(0,2*pi,200)
for j=1:length(vals)
theta = vals(j);
y = sin(theta*x);
plot(x,y)
hold all
end
I can put the legend manually (in this case is easy since it has only 4 values) but I would like something that generates it automatically.
thank you very much!
Laura-
Keep the handles to the plots through each cycle (pre-allocate that array), and then use that to create your legend after the loop.
–Loren
Is it possible for a user to define his own type of marker, in addition to the ones supplied by Matlab? I want to define one that looks like a minus sign ( - )
Thanks!
Tzortz-
There currently is no way for users to define their own marker styles. You might be able to fake it with your own hggroup, but I haven’t tried that myself.
http://www.mathworks.com/access/helpdesk/help/techdoc/ref/hggroup.html
–Loren
Nice blog!
I have a single plot that I’m going to read into a word document. I’m having trouble removing the excessive white-space around my plot. Any thoughts? Thanks!
Jeremy
Gang Wang -
see this http://www.mathworks.com/matlabcentral/fileexchange/1892-dashline.
it does what you want.
Dear Loren,
Thanks for the hints. I do have a another question that is related to the default settings for figures. I’d like to set different default figure/text properties on the root level, e.g.:
This works fine for a single MatLab session. But since I’m working with command line input as well as functions or scripts, it would be helpful to save it in a default file that is loaded every time MatLab is started. The work-around would be to execute the commands for the defaults on every MatLab start-up. Help is greatly appreciated.
Till-
Check out the startup.m file. Placing your commands in their ensure your preferences are set each time your run MATLAB.
–Loren