File Exchange Pick of the Week

July 24th, 2009

Using multiple colormaps in a single figure

Former "Pickmaster" (and current blogger) Doug Hull suggested that John Iversen's color freezer might be "Pickworthy." I wholeheartedly agree.

Suppose you wanted to display the image of a clown that ships as a MATLAB demo. This snippet would do the trick:

load clown;
image(X);
colormap(map);

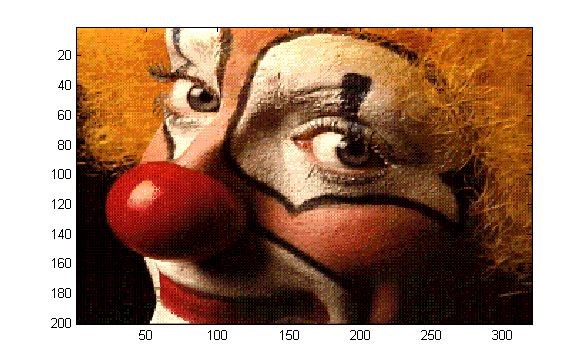
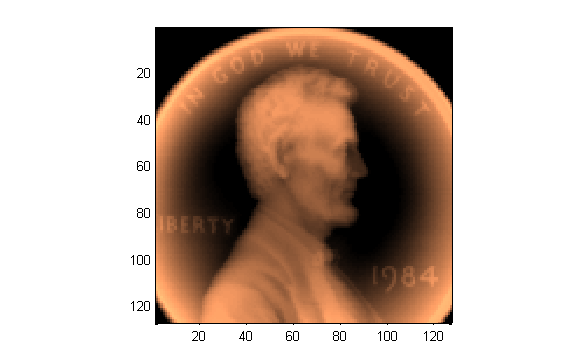
Similarly, if you wanted to display a penny with a copper colormap, this would work:

load penny.mat
contour(P,15)
colormap(copper)
axis ij square
pcolor(P)
axis ij square
shading flat

But what if you wanted to show the two graphics in one figure window? Colormaps are properties of figures, so it's a bit more complicated to do that than you might think:

figure('color','w')
subplot(1,2,1)
image(X);
colormap(map);
subplot(1,2,2)
contour(P,15)
colormap(copper)
axis ij square
pcolor(P)
axis ij square
shading flat

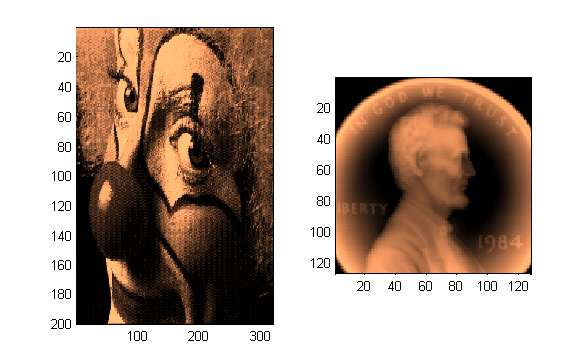
Notice that the second call to colormap affects the image of the clown as well as that of the penny. There are ways to circumvent this behavior. Notably, you could combine the two colormaps into one, and then use different portions of the concatenated colormap for each graphic displayed. Or, if you have the Image Processing Toolbox and are dealing exclusively with images, you can use function subimage to visualize images with different colormaps.

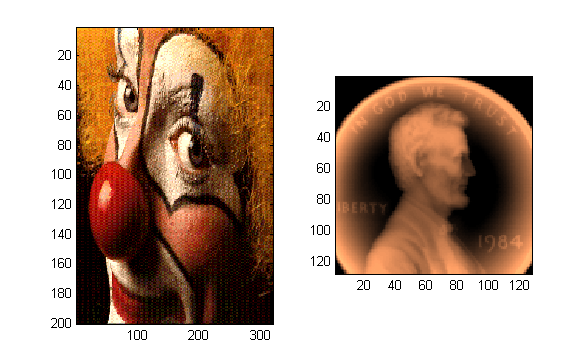
But John's submission makes it considerably easier to combine graphics; just issue a freezeColors command after drawing the clown image, then generate the display of the penny:

figure('color','w')
subplot(1,2,1)
image(X);
colormap(map);
% Here's John's contribution:
freezeColors

subplot(1,2,2)
contour(P,15)
colormap(copper)
axis ij square
pcolor(P)
axis ij square
shading flat

I've been meaning to write a similar function for years. Now I don't have to. Thanks, John!

Comments? Leave them here.


Get the MATLAB code

Published with MATLAB® 7.8

7 Responses to “Using multiple colormaps in a single figure”

  1. Luca Balbi replied on :

    I’ve used freezeColors for quite some time now. It proved realy useful for me, I am always working with medical images (grayscale) along with some ‘debug’ plots which simply show better using, say, ‘flag’ or ‘jet’. So I’ve created my specialised plot functions, making use of freezeColors.

  2. Brett replied on :

    Thanks for the comment, Luca. I don’t see your specialized plot functions on the File Exchange. Might others benefit from them? ;)
    Brett

  3. Andrew replied on :

    I have used and like freezeColors. It might be worth noting that the trick that freezeColors uses is to convert the color values to rgb…that way the colormap of the figure no longer applies. Once you know that, there are several tools to get multiple colormaps on the same figure or axes. I like to use Oliver Woodford’s FEX submission, SC (http://www.mathworks.com/matlabcentral/fileexchange/16233) to convert indexed images as well as cdata for surf plots into RGB. Here is a simple example:

    [x,y,z]=peaks(50);
    
    zpos=z;
    zpos(z<=0)=NaN;
    zrgb=sc(zpos,'hot');
    
    figure
    sh(1)=surf(x,y,z);
    hold on
    sh(2)=surf(x,y,zpos,zrgb);
    set(sh,'edgecolor','none')
    
  4. Jody Klymak replied on :

    I love this entry too, and had my own kludges for years to make it happen, but Iverson’s solution is much more elegant.

    It is unfortunate that this requires a workaround to include colorbars. I actually don’t understand the logic behind the new way the colorbar class is implemented. I love how you can place the colorbars, but having them redraw everytime a new graphic element is added seems unnecessary.

    Of course all this fudging could be solved if colormaps were associated with axes rather than figures. It really seems like a holdover from the days when graphics cards couldn’t handle more than 256 colors. Seems like a simple change that would be easily backwards compatible.

  5. Carlos Adrian Vargas Aguilera replied on :

    Yes, this is a very useful contribution by John. By the way, to freeze the colorbar you can use my CBFREEZE:

    % DATA
    load clown;
    load penny.mat
    
    % FIGURE
    figure('color','w')
    
    subplot(1,2,1)
    image(X);
    colormap(map);
    cbfreeze   % --------------> FREEZE COLORBAR
    % Here's John's contribution:
    freezeColors
    
    subplot(1,2,2)
    contour(P,15)
    colormap(copper)
    axis ij square
    pcolor(P)
    axis ij square
    shading flat
    colorbar
    

    Download it here:
    http://www.mathworks.com/matlabcentral/fileexchange/24371

    Cheers, Carlos

  6. Igor replied on :

    Very useful and fit-to-practice solution. Thanks.

  7. Igor replied on :

    Very useful and fit-to-practice solution. Thanks.

Leave a Reply

Wrap code fragments inside <pre> tags, like this:

<pre class="code">
a = magic(3);
sum(a)
</pre>

If you have a "<" character in your code, either follow it with a space or replace it with "&lt;" (including the semicolon).


Bob, Brett & Jiro share their favorite user-contributed submissions from the File Exchange.

  • Zach: Hi Doug and Les, I didn’t have a lot of time to mess with this, but I did find a work-around. I plotted...
  • hamed: k
  • Les: @Zach This isn’t exactly what you are looking for but at least it puts all three parameters on the same...
  • Zach: Thanks for your suggestions Doug. I’ll give that a shot and see what happens. I’ve seen many of...
  • Doug: @Zach, I would say to use plotYYY, because that is close to what you want, but using depth as Y makes sense....
  • Doug: @Teja, I think this will work: http://www.mathworks .com/access/helpdesk /help/techdoc/ref...
  • Gify: merry christmas :) nice christmas tree! Regards, Janet Gify
  • Teja: Dear Doug Is there anyway to plot a surface from nonuniform data without meshgrid and griddata? Basically i...
  • Zach: I’m working with geophysical data, so I’d like to produce a depth profile. The y-axis would be...
  • Doug: @Ashok First, please do not use variable names that are MATLAB commands (std and mean). Second, p(j) should be...

These postings are the author's and don't necessarily represent the opinions of The MathWorks.