
Second Version of a COVID-19 Simulator
I have completely rewritten the COVID-19 simulator that I described in last week's blog post and I now have a second version.
A simulation begins when a stream of infected individuals is introduced into a group of healthy individuals. The infection rapidly spreads through the population, reaches a peak when the stream stops and there are fewer potential victims, and eventually runs its course.
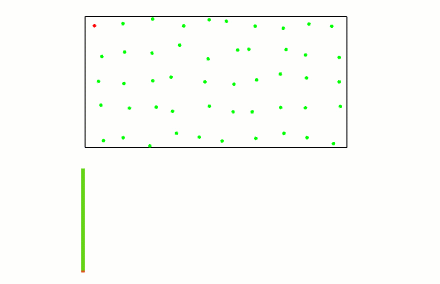
Here is every fifth frame of a typical simulation.

Contents
Agents
The simulation involves quantities that I call individuals. They are reminiscent of the turtles in the programming language Logo, developed by MIT's Seymour Papert in the 1960's. Today there are many programming languages that are descendants of Logo. When I lived in New Mexico several years ago, I was one of the judges in a state-wide competition for high-school students called Supercomputing Challenge. (The name has become a misnomer because most of the participants now use their own personal computers or the machines in a school lab.) A programming environment called NetLogo is a popular choice in the New Mexico Challenge. Papert's turtles have become agents. I am certainly not an expert in agent-oriented computing. Most of what I do know about the subject was gleaned from those high-schoolers' presentations.
Individuals
The simple agents in this simulation move around a two-dimensional square world with constant individual velocities. Some of the individuals are infected with a virus which they pass on to others when they come in close proximity. New individuals are born and die at specified rates. Individuals have an age measured in a fractional number of time steps.
There are six types of individuals.
- Youth. Bright blue. Healthy. Age less than 20. New youth are born during the simulation.
- Adult. Blue. Healthy. Age between 20 and 65.
- Mature. Dark blue green. Healthy. Age over 65. They have stopped traveling and remain fixed "at home".
- Sick. Red. Infected with the virus. Age is irrelevant. They enter the simulation from the upper right at regular time intervals for a specified period of time, then no more enter. They infect others by passing close to them.
- Immune. Red circles. Formerly infected. After a set length of time, the infection in a sick individual runs its course. That individual then becomes immune and can no longer infect others.
- Dead. At a specified mortality rate, sick and immune individuals are removed from the simulation. The number of removals is the death count.
The simulation is initiated with one sick individual moving into a group of adults and is terminated when there are no more live sick individuals.
A barrier with an adjustable length divides the square into two halves. Imagine a wall across Italy, from Civitavecchia on the west coast to Civitanova Marche on the east. Or think of a wall between the United States and Mexico.
Typical simulation.
The simulation in the animation runs for 320 time steps. The time is on the x-axis, while the changing total population is in the title. The infection enters from the northeast and rapidly spreads through the eastern half. A few infected individuals find their way through the narrow gap in the barrier, but the epidemic never gains a foothold in in the west.
Here is the first frame. The are 100 adults of various ages that are not yet infected and one infected individual entering from the northeast corner.

Here is a frame about halfway through at time 180. All five live types are present, but there is no active infection in the west. The total population has risen to 107, which is the maximum seen for this particular run.

Here is the last frame. There are no sick individuals present and no more to come. This particular epidemic is over. There are 96 survivors. A little over half of them had the infection and are now immune. The others were never infected; among them are several youngsters born during the run.

Parameters

Eight parameters are set by the control panel on the left and can be changed during a simulation.
- n. Population size.
- infect. Time steps between introduction of new sick adults.
- birth. Birth rate.
- mortality. Mortality rate.
- virulence. Radius of effectiveness of the virus.
- duration. Time steps before a sick individual becomes immune.
- speed. Time steps between display updates.
- barrier. Length of barrier separating two halves of the region.
Infectious encounters
My dictionary tells me that virulence is the severity or harmfulness of a disease. In this simulator virulence is the radius of the effectiveness of the virus. When a sick individual passes within this distance of someone who is not yet infected, the infection is passed on. The default virulence of .02 is about the size of the dots representing the individuals.
Census
The frame on the right shows the running count for each type of individual. The first five types are alive, and their total number is n, the current population.
History
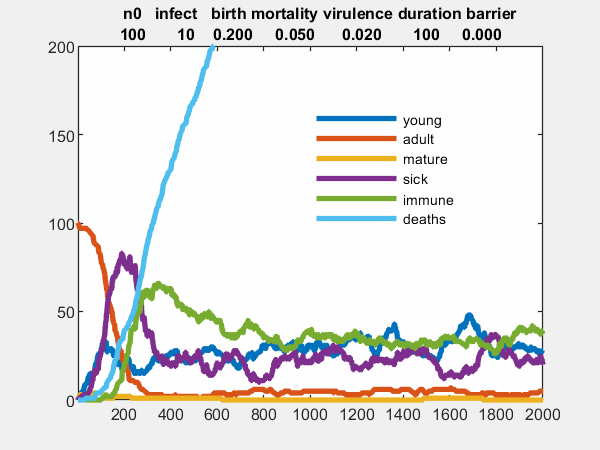
At any time during the simulation, you can click on the plot button. A second figure window pops open with a graph like this one. It plots the census over the entire history of the simulation. The parameter values are shown in the title.

This is the history for the simulation is the animation. You can see that the adult population decreases from 100 at time zero to around 45 when the epidemic is over. The number of both young individuals and mature individuals never gets above 10 is this particular setting. The number of sick individuals peaks near 30 before dropping to zero to end the epidemic. About 40 individuals acquire immunity and a roughly equal number die.
Remove the barrier
Let's change some of the parameters. First, removing the barrier makes small differences. The infection persists for a great number of time steps, the number of adults drops below 40, the number of deaths rises above 50 and the peak number of sick is below 20.

Increase birth rate
Increasing the birth rate results in many more youngsters. The number of sick also rises more quickly and peaks at a higher value, but many of the young survive.

Increase duration
Increasing the duration time for the infection causes many more deaths

Increase virulence
Increasing the virulence causes a higher and earlier peak in the number of sick.

Unstable
Finally, increasing all these values at the same time, and increasing a value that is not in the control panel, namely the length of time that new infected individuals are introduced, results in a simulation that reaches the maximum time limit. After 2000 time steps the number of deaths is over 600 and I have set the limit on the y-axis to 200. The other values are oscillating and have not reached a limit. The situation appears to be unstable and is terminated.
Disclaimer
I make no claim that this simple simulation accurately models the crisis that our world is currently facing. The population is too small, the geography is too crude and the time steps are unreal. I have made no attempt to incorporate any actual data. Nevertheless, I think it roughly behaves like the real thing.
Software
The simulator itself is available from the Central File Exchange at this link and is included in Version 5.1 of Cleve_Lab at this link.
- Category:
- Fun,
- Graphics,
- History,
- Simulation


Comments
To leave a comment, please click here to sign in to your MathWorks Account or create a new one.