
I first encountered the Hilbert matrix when I was doing individual studies under Professor John Todd at Caltech in 1960. It has been part of my professional life ever since.... read more >>

I first encountered the Hilbert matrix when I was doing individual studies under Professor John Todd at Caltech in 1960. It has been part of my professional life ever since.... read more >>


The floating point arithmetic format that occupies 128 bits of storage is known as binary128 or quadruple precision. This blog post describes an implementation of quadruple precision programmed entirely in the MATLAB language.... read more >>

The floating point arithmetic format that requires only 16 bits of storage is becoming increasingly popular. Also known as half precision or binary16, the format is useful when memory is a scarce resource.... read more >>
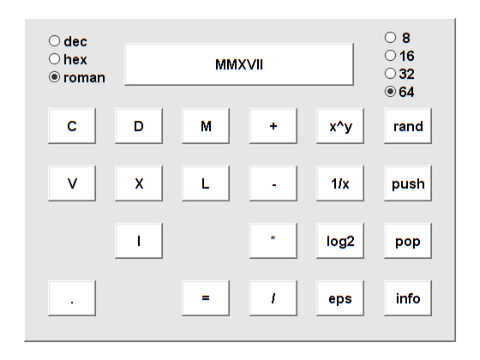
A MATLAB object for arithmetic with Roman numerals provides an example of object oriented programming. I had originally intended this as my April Fools post, but I got fascinated and decided to make it the subject of a legitimate article.... read more >>

A report about a possible bug in format bank and a visit to a local hardware store made me realize that doing decimal arithmetic with binary floating point numbers is like tightening a European bolt with an American socket wrench.... read more >>

I've long known that my Erdös Number is 3. This means that the length of the path on the graph of academic coauthorship between me and mathematician Paul Erdös is 3. Somewhat to my surprise, I recently discovered that I can also trace a chain of coauthorship to Donald J. Trump. My Trump number is 5.... read more >>
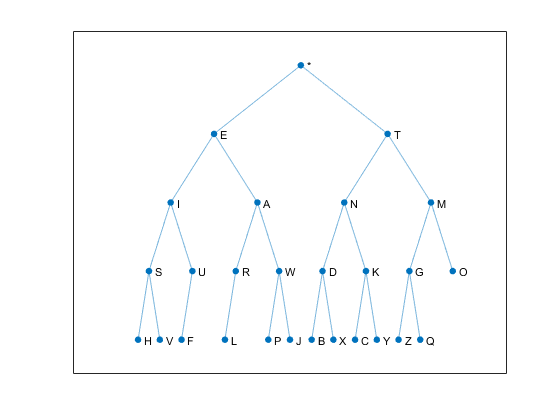
A binary tree is an elegant way to represent and process Morse code. The new MATLAB graph object provides an elegant way to manipulate binary trees. A new app, morse_tree, based on this approach, is now available in version 2.40 of Cleve's Laboratory.... read more >>

The Lake Arrowhead Coauthor Graph came out of the Householder XII conference in 1993 at the UCLA conference center in the mountains north of San Bernardino. John Gilbert now remembers it as one of the first computational social network analyses he had ever seen. Today I revisit it using the new MATLAB graph object.... read more >>

The adjacency matrix of a hypercube demonstrates the new MATLAB graph object.... read more >>
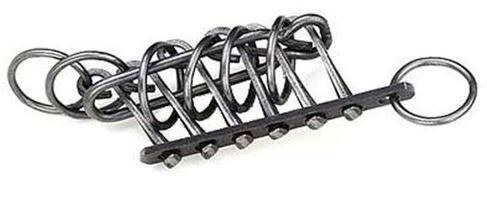
MIT's Professor Daniel Frey recently introduced me to an ancient mechanical puzzle known as "Chinese Rings", "Patience", or "Baguenaudier." I have modified Daniel's simulator to produce a new app. The state space of the puzzle forms a hypercube.... read more >>
These postings are the author's and don't necessarily represent the opinions of MathWorks.