
Private Cody Leaderboards
Anna works in the Interdimensional Transport Group at Yoyodyne Propulsion Systems. Her team of ten engineers is using a lot of MATLAB these days, and she thinks it would be good for them to brush up their skills. But how?
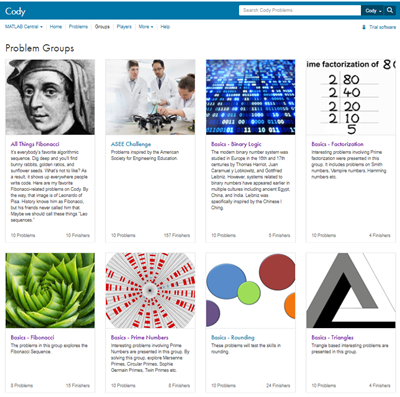
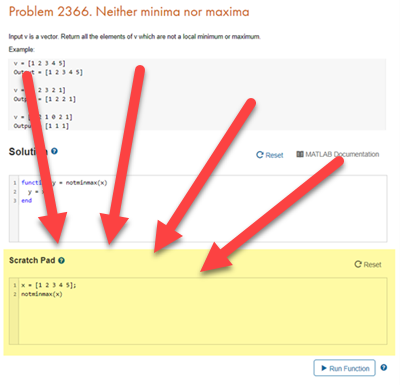
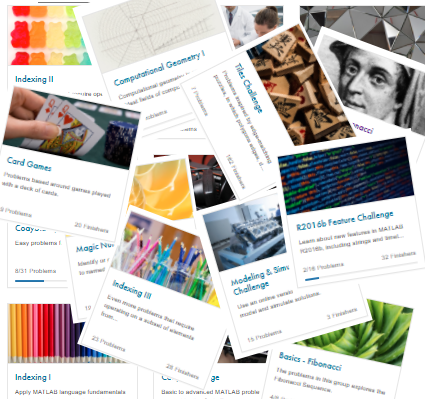
Alex points out that working through Cody problems on MATLAB Central is a fun way to improve at MATLAB coding. He’s been playing off and on for a few months now, working his way through the indexing problems.
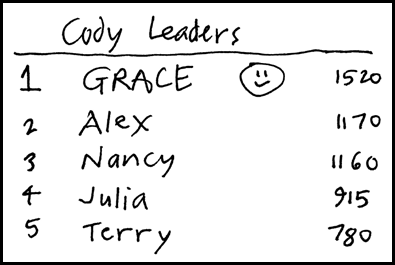
The group agrees to try Cody and compare notes. From time to time they talk about it at the coffee machine. But over time they lose focus. Then one day Amanda has a brilliant idea: “We need a score board!” That evening, after work, she writes down everyone’s score and posts it next to the coffee pot. It looks like this.
Automating the Process
This worked like a charm. Working on Cody became like an intramural sport at Yoyodyne. People swapped stories about their favorite hacks in addition to the occasional vectorization trash talk. But after a week of this, Amanda grew tired of gathering the nightly scores by hand. What to do? Alex said “Using the skills I’ve learned playing Cody, I bet I can automate this.” He wrote a function that gathers the data and generates an HTML leaderboard. You just pass in the Cody ID numbers of all the players, and the code does the rest.
He stored the names and IDs in a little CSV file. This is easy to read into a MATLAB table.
playerTable = readtable("names.csv")
Now call the leaderboard function.
makeLeaderboard("leaderboard.html",playerTable.ID)
The result looks like this.
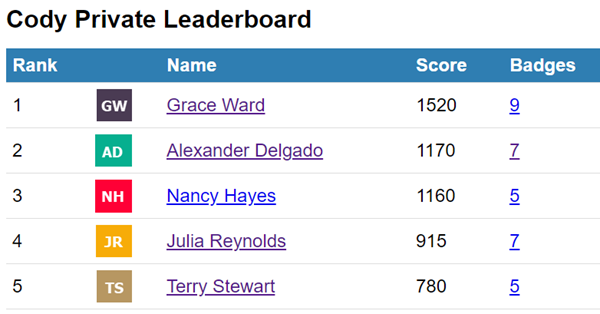
Anna attached this code to a nightly scheduled task on her PC. Now, every day when she arrives at work, she can quickly scan for changes in the lead.
Showing the History
After they’d been playing like this for a month, Rebecca thought it would be nice to see a historical record of their scores. That way she could see the trajectories of various players as they moved up and down in the rankings. She wrote a script that gathered the data every night and saved it to another CSV file.
Instead of just generating the leaderboard every night, now she ran this code to gather and save data.
scoreTable = gatherScoreData("scores.csv",playerTable.ID)

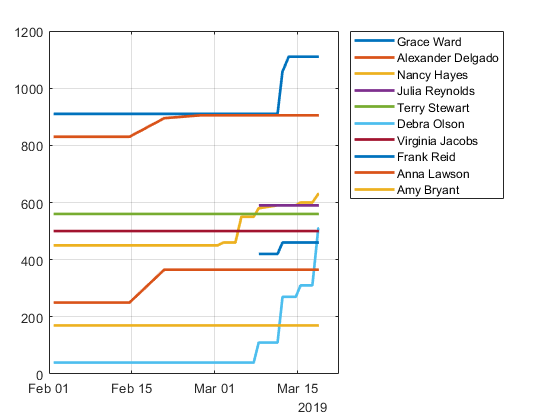
Using this historical data, Rebecca could plot the scores over time.
[scoreMatrix,t,playerNames] = makeScoreMatrix(scoreTable,playerTable);
plot(t,scoreMatrix,"LineWidth",2)
legend(playerNames,"Location","northeastoutside")
grid on
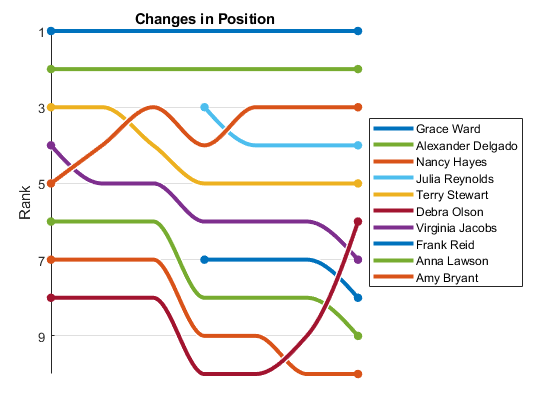
Finally, for a fun sort of horse-race plot, she made an abstract rank plot that showed changes in position over time. You can really see Debra sweeping up the ranks from last place into the middle of the pack.
makeRankPlot(scoreMatrix,t,playerNames)
What Have You Done for Me Lately?
With all the historical data in place, it’s easy to show the leaderboard for any point in the recorded history. Who was leading on March 15th?
t2 = datetime(2019,3,15)
t2 = datetime
   15-Mar-2019
currentLeaderTable = leaderTableAtTime(playerTable,scoreTable,t2)

This functionality let Anna fix something that had been bugging her. Some people, like Grace and Alex, had been playing Cody for a long time. It somehow didn’t seem fair for other people, new to Cody, to have to compete with them on the same absolute scale. So they created a monthly competition in which everyone was ranked by how many points they had scored in the preceding month.
nDays = 30;
t1 = t2 - days(nDays)
t1 = datetime
   13-Feb-2019 00:00:00
dMinus30Table = leaderTableAtTime(playerTable,scoreTable,t1)

currentTable = leaderTableAtTime(playerTable,scoreTable,t2);
Rank = zeros(height(playerTable),1);
RankChange = zeros(size(Rank));
ScoreChange = zeros(size(Rank));
BadgeChange = zeros(size(Rank));
for i = 1:height(currentTable)
    Rank(i) = i;
    ixOld = find(dMinus30Table.Id==currentTable.Id(i));
    if isempty(ixOld)
        RankChange(i) = NaN;
        ScoreChange(i) = currentTable.Score(i);
        BadgeChange(i) = currentTable.Badges(i);
    else
        RankChange(i) = ixOld - Rank(i);
        ScoreChange(i) = currentTable.Score(i) - dMinus30Table.Score(ixOld);
        BadgeChange(i) = currentTable.Badges(i) - dMinus30Table.Badges(ixOld);
    end
end
% Augment the current table with four new columns.
currentTable = [currentTable table(Rank,RankChange,ScoreChange,BadgeChange)];
% Sort by the ScoreChange column.
currentTableSorted = sortrows(currentTable,'ScoreChange','descend');
currentTableSorted(:,[1 3 7])

Now it’s clear that, although Grace still has the highest score, Julia achieved the most in the last month. You can bet this came up the next time the two of them chatted next to the coffee machine.
Where’s the Code?
As you have no doubt guessed, the company in this story is fictional. But the code is not. And the scenario described is also very true. There are, right now, companies running their own localized Cody competitions exactly as described here. We know because we’ve heard from them and they’ve told us that, sure enough, a little competition does wonders for the motivation. And most importantly, people really are learning valuable MATLAB skills that they can apply on the job.
If you want to set up an intramural Cody competition at your office, just download the code from the File Exchange here.
(also available on GitHub here: https://github.com/mathworks/Private-Cody-Leaderboards)
Try it! Tell me in the comments if you start a Cody League, and let me know what other features you’d like to see.
- Category:
- Cody


Comments
To leave a comment, please click here to sign in to your MathWorks Account or create a new one.