Code Generation from Import Wizard
Some colleagues and I were talking to some customers recently at a seminar and asked them what some of their favorite new features are. One of the top ones is being able to generate code from the Import Wizard.
Contents
What is the Import Wizard?
Some of you may ask what the Import Wizard is. It's a graphical tool that allows you to load in data to MATLAB without knowing the explicit format of the data. For some projects, you may have many data files with consistent formats, but you don't necessarily know the format until you look at a representative file. With the Import Wizard, you can read in the first data set the way you'd like and generate code for the process. Now you can use the generated M-file to automate importing additional files for future processing.
Working with External Data
In a recent post, I converted a collection of .mat-files containing audio data to a set of .wav files. Since MATLAB already contains wavread for reading in wav-files, we can automate reading in this sort of data already. But suppose instead we had a set of spreadsheets, each containing two columns of data, with headers time and temperature. We could certainly use xlsread, but it would be a bit of work and programming to get the data into two variables named time and temperature.
Using the Import Wizard
Instead, I can use the import wizard to help figure out how I want to represent the data. Let's see what the wizard looks like for the first file: timetempPHX.xls.

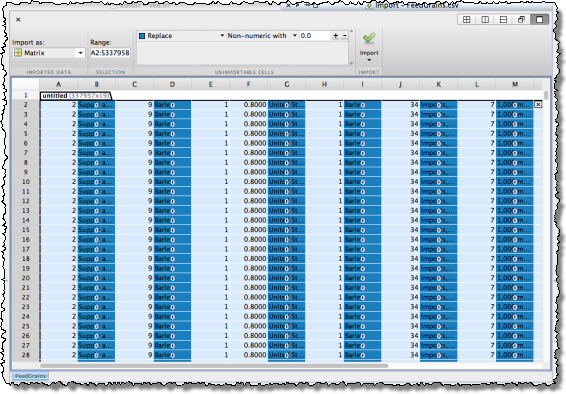
You can see that I can read the data in, with column names and other text data placed into cells. I can also read the data into variables, with the column names becoming the variable names in MATLAB.

Now look in the lower right corner and you will see a check box that I now select to generate code for this dataset.

After the code is generated, I save the file as importfileTimeTemp.m.
Using the Generated Code
Now I can read in these files in a more automated way, allowing me to script some analysis. We'll load two such datasets and plot them on the same figure to compare fabricated monthly average high temperatures for a year in Boston and Phoenix.
importfileTimeTemp timetempPHX.xlsConvert months into the correct format for the year 2005.
date = datenum(2005,month,1);
ticks = cumsum([min(date) 31 28 31 30 31 30 31 31 30 31 30]);
Plot the first data set, set x-axis ticks correctly, then get and plot the second set of data. Finally, add a legend and title.
plot(date,temperature,'r*')
set(gca,'Xtick',ticks)
datetick('x',3,'keepticks')
importfileTimeTemp timetempBOS.xls
hold on
plot(date,temperature,'bo')
title('Guesses for average daily high temperatures')
legend({'Phoenix' 'Boston'},'location','northwest')
hold off

What Features Work Well for You?
In the past couple of blog articles, I have tried to show you some of the features new to R2006b. Which features solve a problem for you? Let me know.
Published with MATLAB® 7.3
- Category:
- New Feature,
- Tool


Comments
To leave a comment, please click here to sign in to your MathWorks Account or create a new one.