
Colormap Manipulations
We use color as a dimension to understand the world. For some datasets, judicious choice of colormaps provides a useful means for gleaning information.
Contents
Basic Colormap Manipulation
Let's start with a grayscale image from the Image Processing Toolbox and display it using imshow.
imshow cameraman.tif
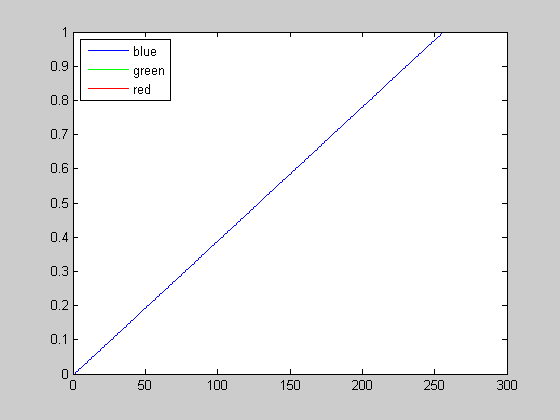
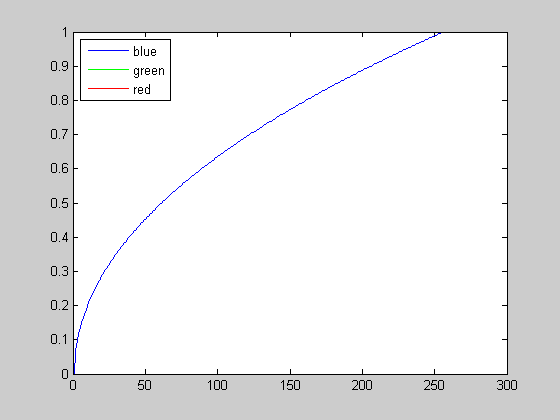
and let's take a quick look at the colormap
cm = get(1,'colormap');
figure
rgbplot(cm)
legend(get(gca,'children'),{'blue' 'green' 'red'},'location','NorthWest')
or superpose a colorbar on the image plot.
figure(1)
colorbar SouthOutside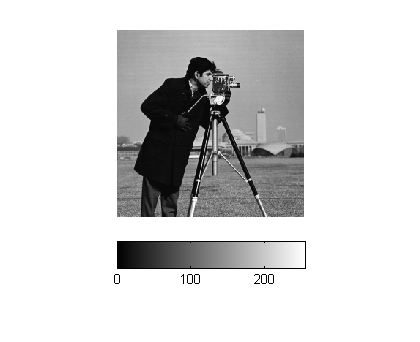
It's difficult at first to see much detail about the man's clothing. Using the MATLAB function brighten, we can change the colormap and see more detail in the darker regions.
brighten(.2)
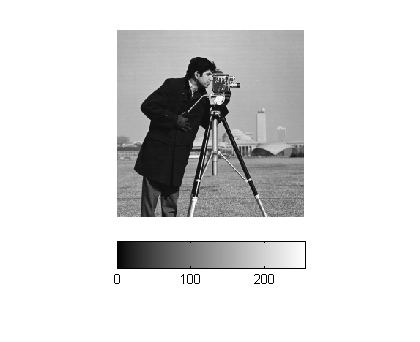
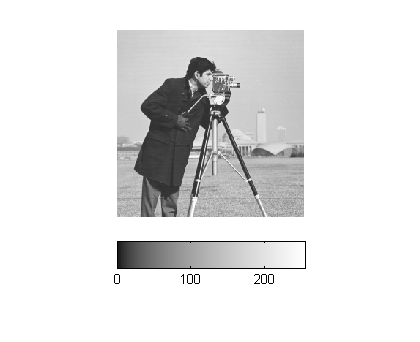
Notice the extra detail around the buttons and glove when we brighten the colormap more (at the expense of the lighter background).
brighten(.4)
Now let's see what the individual channels look like.
cm = get(1,'colormap');
figure(2)
rgbplot(cm)
legend(get(gca,'children'),{'blue' 'green' 'red'},'location','NorthWest')
close(2)
Other "Simple" Colormap Manipulations
Colormaps contain are 3-column matrices with double values lying between 0 and 1. So what manipulations can we easily do to create new colormaps from existing ones? Here are some simple ones.
colorbar off
colormap(1-cm)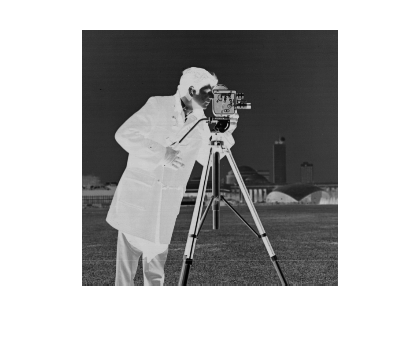
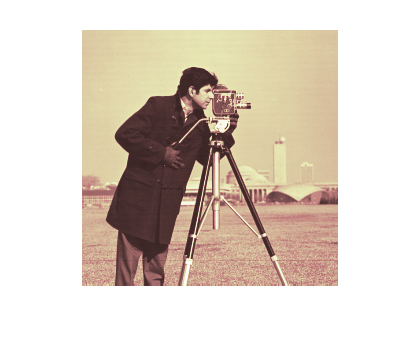
Get another monotonic colormap and see other colormap choices.
help pink PINK Pastel shades of pink color map
PINK(M) returns an M-by-3 matrix containing a "pink" colormap.
PINK, by itself, is the same length as the current figure's
colormap. If no figure exists, MATLAB creates one.
For example, to reset the colormap of the current figure:
colormap(pink)
See also HSV, GRAY, HOT, COOL, BONE, COPPER, FLAG,
COLORMAP, RGBPLOT.
This is not quite the sepia tones for an old-fashioned photograph look, but it's getting close.
colormap(pink)
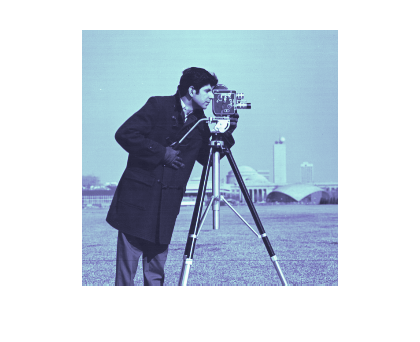
colormap(fliplr(pink))
Pitfalls
You can run into some pitfalls with colormaps. Here are a few to watch out for.
- Using the wrong length colormap can lead to very poor results. This makes the display look totally wrong. Try this.
load clown
image(X),colormap(map)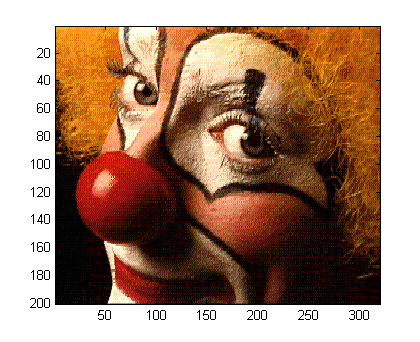
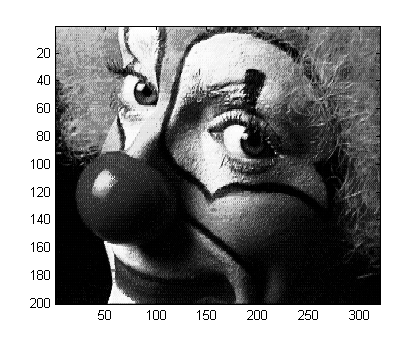
Now make the colormap gray
colormap(gray(length(map)))
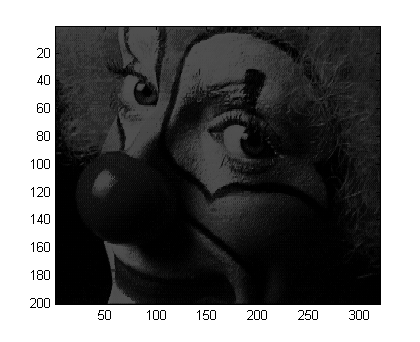
Next display the clown using an inappropriate colormap.
colormap(gray(256))
- Colormap is not double or not in the correct range (between 0 and 1).
- In MATLAB version 4, the default colormap was hsv. The hsv colormap starts and ends with red, making it is very hard to interpret colors as high or low.
close
image(1:64)
axis off
colormap(hsv(64))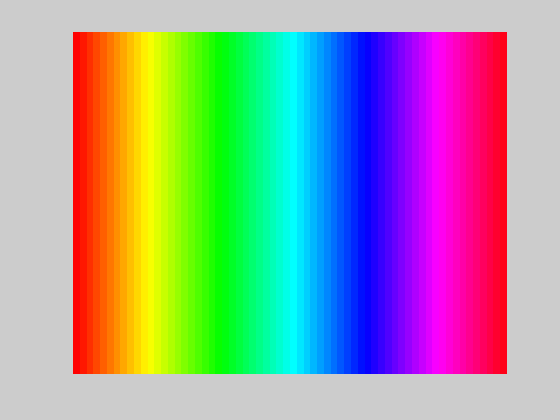
Starting in MATLAB 5, the default colormap is jet.
colormap(jet)

Resources
Here are some resources for learning more about color and colormaps in MATLAB.
- Steve's blog article: A Lab-based uniform color scale
- Eos, Vol. 85, No. 40, 5 October 2004, The End of the Rainbow? Color Schemes for Improved Data Graphics
- MATLAB Central File Exchange: Image Processing - Color
- MATLAB's colormapeditor
What additional resources on color would be useful? Let me know here.
- Category:
- Less Used Functionality


Comments
To leave a comment, please click here to sign in to your MathWorks Account or create a new one.