Coordinating Views
Ever wanted to have coordinated views of multiples plots when you pan or zoom? You can do this in MATLAB.
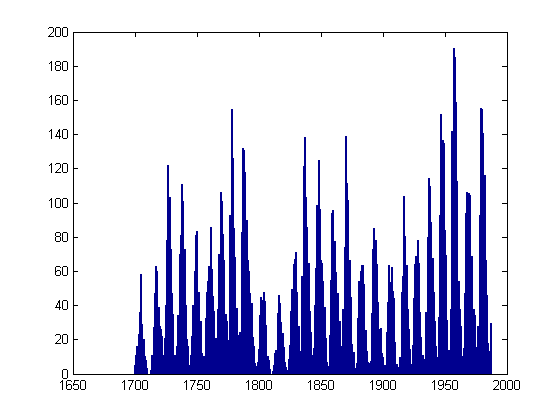
Let's suppose I have two plots and I want to be sure they keep their x-axes synchronized. I'll start by loading the sunspot data.
sdata = load('sunspot.dat');
time = sdata(:,1);
spots = sdata(:,2);
I've heard that there is an 11-year cycle for sunspots. So let me generate a sinusoid with a period of 11 years so we can then do a visual comparison (vs. the more appropriate Fourier analysis!).
cycle11 = sin(time*pi*2/11);
Now let's plot the two curves, but in different axes since the scalings are quite different and I don't want to worry about them.
hspots = subplot(2,1,1);
plot(time,spots)
h11 = subplot(2,1,2);
plot(time,cycle11)
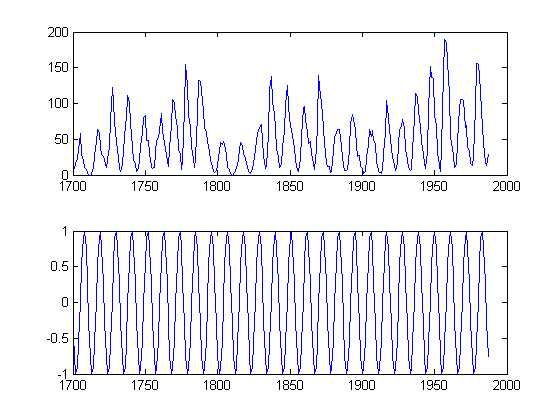
Here I ensure the plots have the same x-axis by explicitly plotting the data using the same x-coordinates. But let's say I want to zoom in now. I can achieve this by setting both x-axes with the same limits. I could do them one at a time, or together.
set([hspots h11],'xlim',[1900 1950]);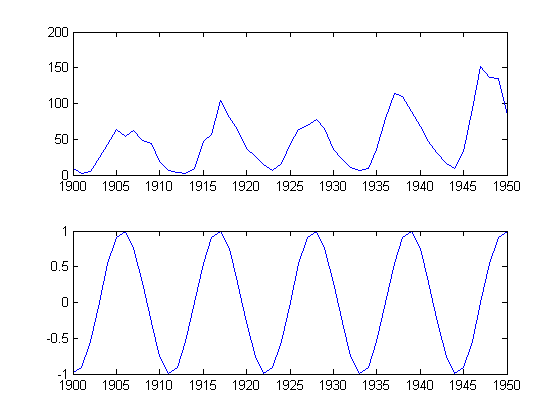
I can still make "mistakes" though, by setting the limits on only one of the axes.
set(h11,'xlim',[1850 1900])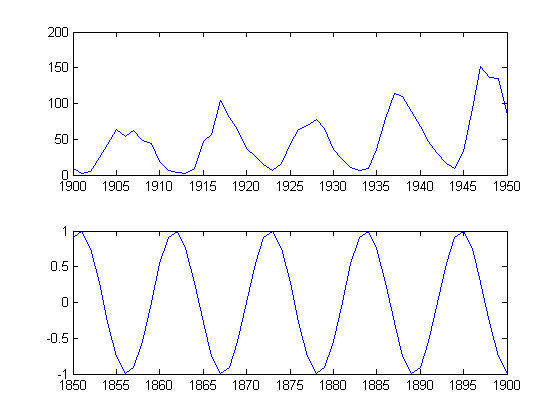
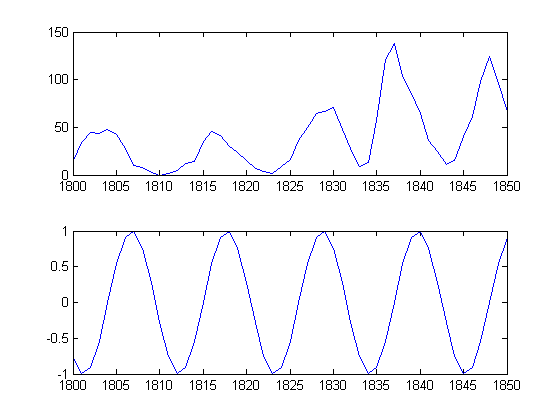
I can achieve the synchronization, with a little less mental effort than carrying around all affected axes, by using the function |linkaxes.
linkaxes([h11 hspots],'x')
set(h11,'xlim',[1800 1850])
Do you have a simple way to coordinate your plots? Let me know here.




コメント
コメントを残すには、ここ をクリックして MathWorks アカウントにサインインするか新しい MathWorks アカウントを作成します。