Visualizing the Gulf of Mexico Oil Slick Using Web Map Service (WMS)
Today I'd like to introduce a guest blogger, Kelly Luetkemeyer, who is a Mapping Toolbox software developer at The MathWorks. Kelly was the lead developer on the project to incorporate Web Map Service (WMS) into the Mapping Toolbox.
Contents
- Introduction
- Obtain Daily Planet Layer
- Update the Layer and Display the Abstract
- Define the Region-of-Interest
- Obtain the Image
- Display the Caption
- Display the Image
- View the Image at Full Resolution
- View the Image Using the WMS URL
- Obtain May 1, 2010 Image
- Enhance the Image
- Display Both Images
- Using Google™ Earth with WMS
- Conclusion
Introduction
Recently, the tragic accident in the Gulf of Mexico caused me to think if The MathWorks tools could be used to help visualize the oil slick using imagery from Web Map Service (WMS) servers. I'll show you how to use WMS functionality in Mapping Toolbox to obtain MODIS imagery of the region. The MODIS sensor is onboard NASA's Terra satellite. WMS is a standard developed by the Open Geospatial Consortium (OGC) that allows clients to access web servers to obtain maps rendered as an image. We have cataloged over 1000 WMS servers and their layers and stored that information into a database shipped with the Mapping Toolbox. I will use that database to find a server that provides MODIS imagery.
Obtain Daily Planet Layer
The NASA WMS server located at the Jet Propulsion Laboratory (JPL) in Pasadena provides a continuously updating composite of visual images from the MODIS sensor onboard the Terra satellite. I can obtain the stored layer's information with the wmsfind function and narrow the search using the refine method of the WMSLayer object.
jpl = wmsfind('onearth.jpl', 'SearchField', 'serverurl');
daily_planet = jpl.refine('daily_planet');
Update the Layer and Display the Abstract
The information stored in the database is only a partial subset. I can update the layer with the latest information from the server by using the wmsupdate function. Once the layer is updated, I can display the layer's abstract information.
daily_planet = wmsupdate(daily_planet);
disp(['<html><bf>' daily_planet.Abstract '</bf></html>'])
A contiunously updating composite of visual images from TERRA MODIS scenes, see http://modis.gsfc.nasa.gov for details about MODIS.
	This dataset is built local on the OnEarth server, it updates as soon as scenes are available, usually with a 6 to 24 hour delay from real time.
        Images are produced from MODIS scenes using the HDFLook application.
	Base resolution is 8 arcseconds per pixel. The WMS "time" dimension can be used to retrieve past data, by using the YYYY-MM-DD notation.
Define the Region-of-Interest
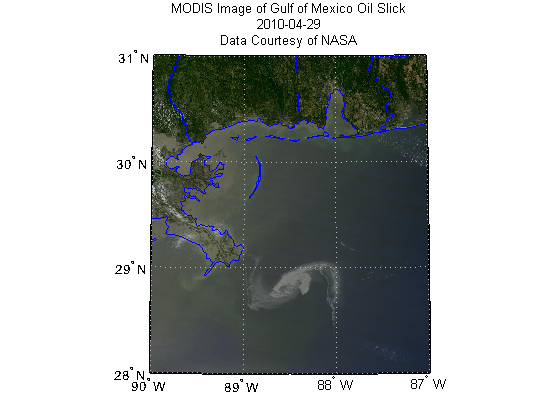
I define the latitude and longitude bounds for a region surrounding the oil slick and request pixels at 8 arcseconds. The time variable is used to request the image from April 29, 2010.
latlim = [28 31];
lonlim = [-90 -87];
cellSize = 8/3600;  % 8 arcseconds
time  = '2010-04-29';
Obtain the Image
The wmsread function retrieves the image from the server. The output A is the image, R is the referencing matrix, and URL is a WMS URL that can be used in a browser to download the image. The image coordinates are in latitude and longitude. Please note that sometimes this WMS server is busy and may issue an error message due to server overloading. If this happens, please try again at a later time.
[A, R, URL] = wmsread(daily_planet, 'Time', time, ...
    'CellSize', cellSize, 'Latlim', latlim, 'Lonlim', lonlim);
Display the Caption
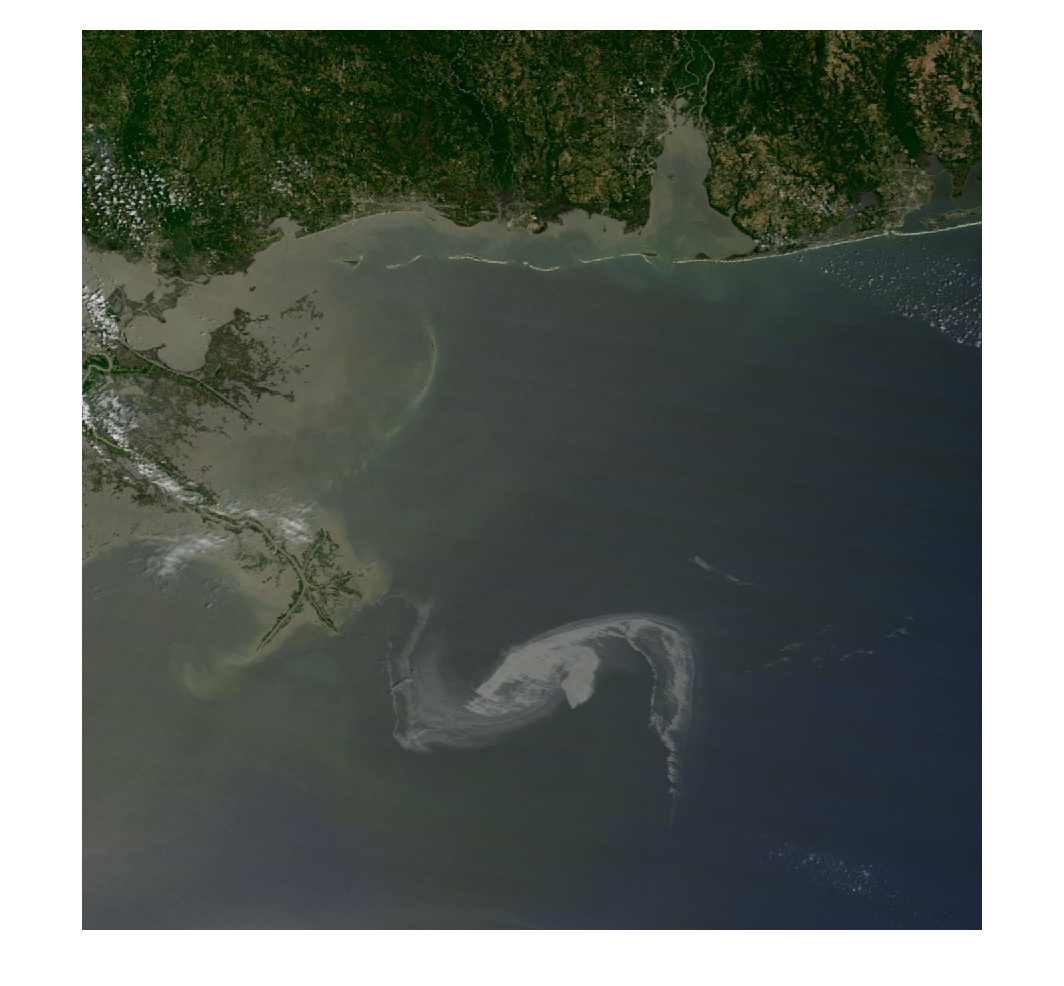
I initially found the MODIS image on a NASA website at http://www.nasa.gov/topics/earth/features/oil-creep.html. I copied the caption from the website and placed it into a file.
fid = fopen('caption.txt');
c = fread(fid,'char=>char');
fclose(fid);
disp(['<html><bf>' c' '</bf></html>'])
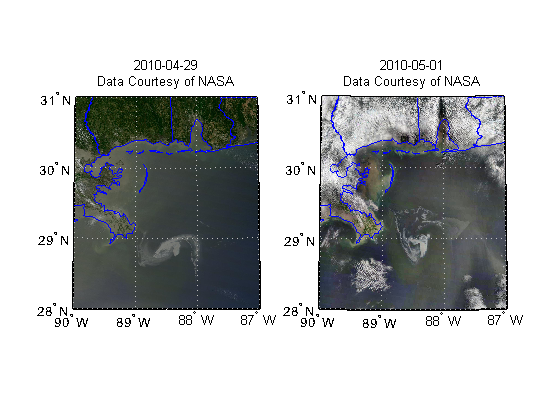
On April 29, the MODIS image on the Terra satellite captured a wide-view natural-color image of the oil slick (outlined in white) just off the Louisiana coast. The oil slick appears as dull gray interlocking comma shapes, one opaque and the other nearly transparent. Sunglint -- the mirror-like reflection of the sun off the water -- enhances the oil slick’s visibility. The northwestern tip of the oil slick almost touches the Mississippi Delta. Credit: NASA/Earth Observatory/Jesse Allen, using data provided courtesy of the University of Wisconsin’s Space Science and Engineering Center MODIS Direct Broadcast system.
Display the Image
Since A is an RGB image, I can use the Image Processing Toolbox function imshow to display it. The coordinates of the image are in longitude (rows) and latitude (columns).
I can use the Mapping Toolbox function geoshow to reproject the image into a Lambert projection. With the Mapping Toolbox functions, I can also overlay geographic data onto the map, in this case, the boundaries of the states in the region-of-interest. The boundaries of the states are obtained from the shapefile included with the Mapping Toolbox.
S = shaperead('usastatehi.shp', 'UseGeoCoords', true);
figure('Renderer','zbuffer')
usamap(A,R)
geoshow([S.Lat], [S.Lon]);
geoshow(A,R)
title({'MODIS Image of Gulf of Mexico Oil Slick', time, ...
    'Data Courtesy of NASA'});
View the Image at Full Resolution
You can view the full image in your browser by clicking on the following link: https://blogs.mathworks.com/images/loren/231/gom.png
View the Image Using the WMS URL
If you do not have the Mapping Toolbox, you can still use WMS if you know the WMS URL. The third output from wmsread provides this information. If you insert this URL into a browser, the browser will download the image from the WMS server. You can also use the MATLAB function, urlwrite(URL, filename) to download the image.
disp(URL(1:52)), disp(URL(53:95)), disp(URL(96:140))
disp(URL(141:170)), disp(URL(171:212)), ...
disp(URL(213:262)), disp(URL(263:end))
http://onearth.jpl.nasa.gov/wms.cgi?TIME=2010-04-29& SERVICE=WMS&LAYERS=daily_planet&EXCEPTIONS= application/vnd.ogc.se_xml&FORMAT=image/jpeg& TRANSPARENT=FALSE&HEIGHT=1350& BGCOLOR=0xFFFFFF&REQUEST=GetMap&WIDTH=1350 &BBOX=-90.0,28.0,-87.0,31.0&STYLES=&SRS=EPSG:4326& VERSION=1.1.1
Obtain May 1, 2010 Image
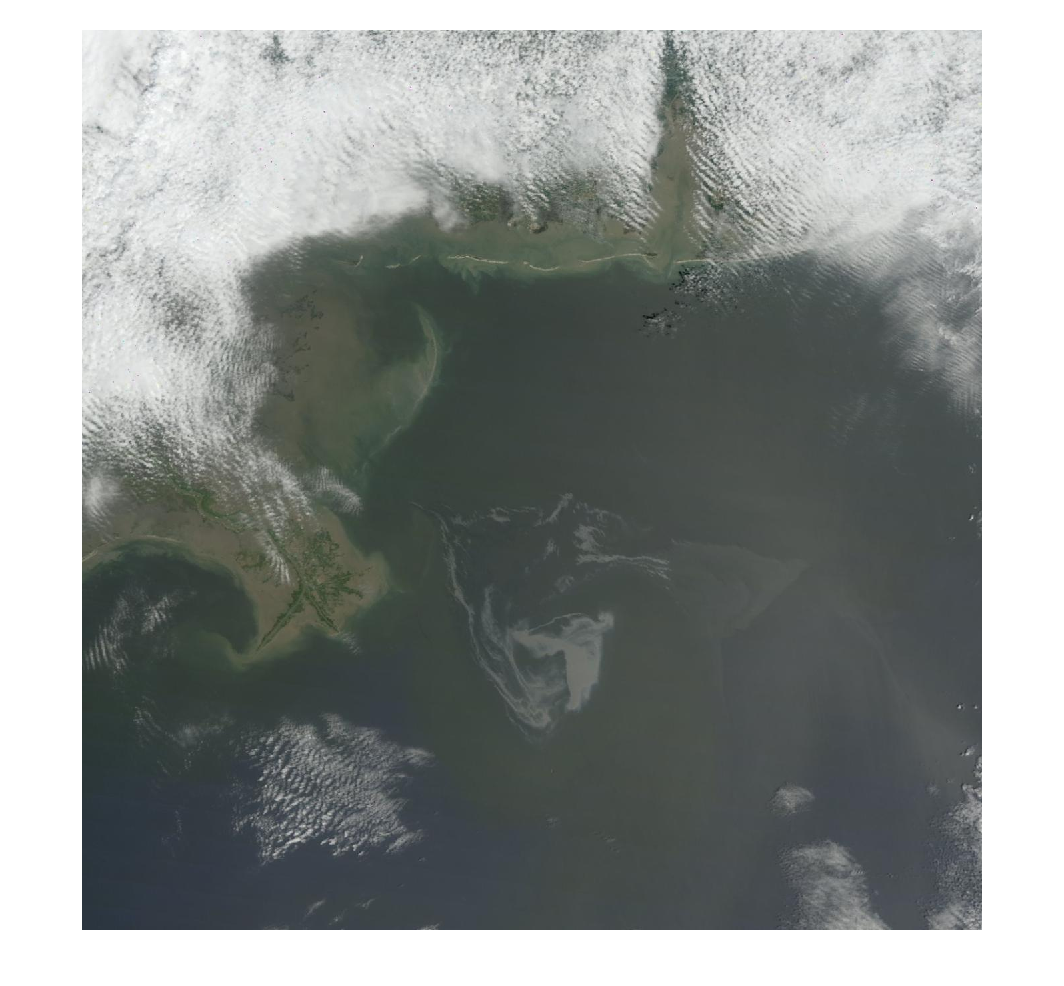
The imagery from April 30 through May 6, excluding May 1, is either missing, because the area was not imaged at that time by the sensor, or the region is cloudy. I'll download the May 1 imagery for comparison and see how the shape and size of the oil slick has changed.
time  = '2010-05-01';
[A2, R] = wmsread(daily_planet, 'Time', time, 'CellSize', cellSize, ...
    'Latlim', latlim, 'Lonlim', lonlim);
figure
imshow(A2)
Enhance the Image
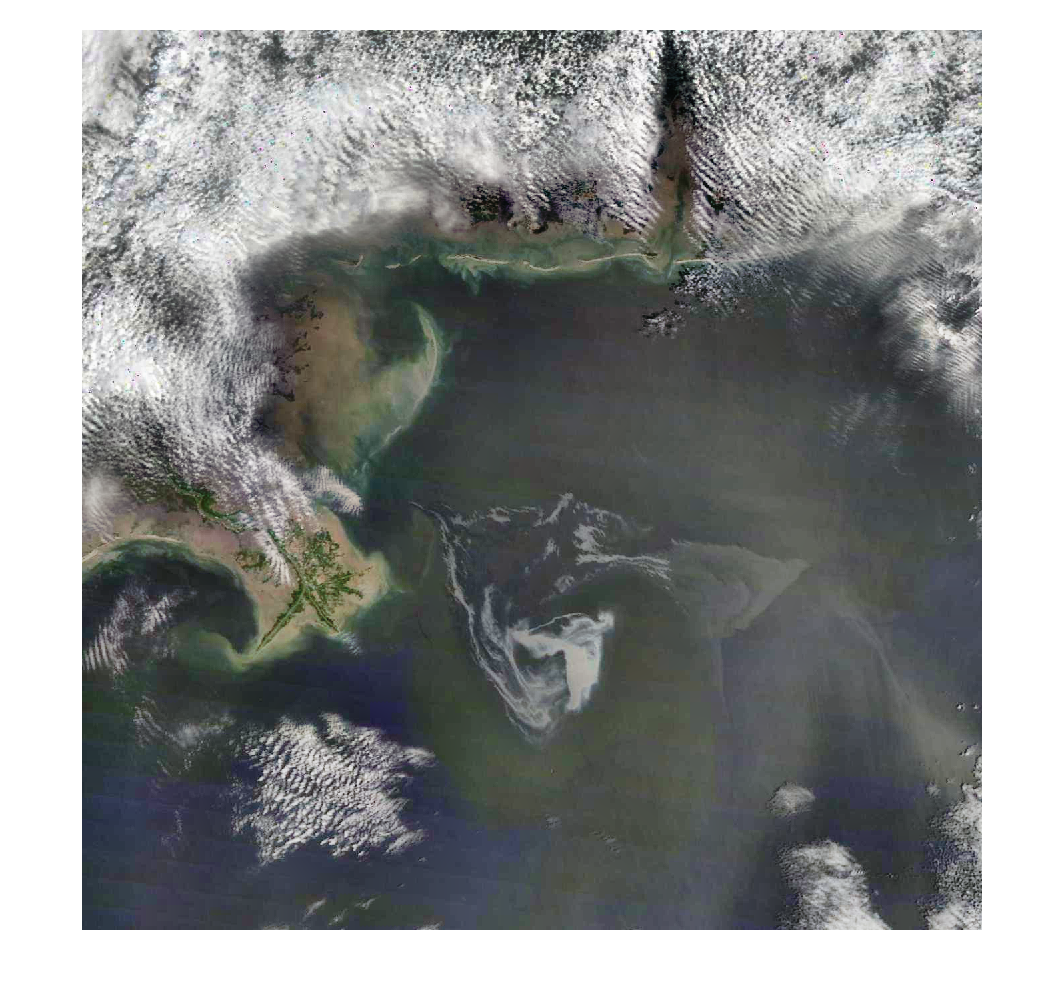
The image can be enhanced by using the adapthisteq function from the Image Processing Toolbox.
B = A2;
for k=1:3
 B(:,:,k) = adapthisteq(A2(:,:,k));
end
figure
imshow(B)
Display Both Images
For comparison, I'll place both the April 29 and the enhanced May 1 imagery in the same Figure window. You can see how the shape and size of the oil slick has changed.
figure('Renderer','zbuffer')
subplot(1,2,1)
usamap(A,R)
geoshow(A,R)
geoshow([S.Lat], [S.Lon]);
title({'2010-04-29', 'Data Courtesy of NASA'})

subplot(1,2,2)
usamap(B,R)
geoshow(B,R)
geoshow([S.Lat], [S.Lon]);
title({'2010-05-01', 'Data Courtesy of NASA'})
Using Google™ Earth with WMS
Some WMS servers support non-image outputs. The daily_planet.Details.ImageFormats variable contains all the output types that the JPL server supports. One output type is 'application/vnd.google-earth.kml+xml'. I will modify the URL to specify KML as the output. You can use this file, gom.kml, in Google™ Earth to view the imagery.
kmlURL = strrep(URL, 'image/jpeg', ...
    'application/vnd.google-earth.kml+xml');
urlwrite(kmlURL, 'gom.kml');
Conclusion
I've shown how MATLAB, combined with functions from the Mapping Toolbox and Image Processing Toolbox, can be used to visualize and enhance data for a current event. Do you have any ideas how you can use these tools to follow or analyze a current event? Let me know here.
- Category:
- Image Processing,
- Mapping,
- News




Comments
To leave a comment, please click here to sign in to your MathWorks Account or create a new one.