MATLAB R2014b Graphics – Part 3: Compatibility Considerations in the New Graphics System
Today, David Garrison, our guest blogger, will continue his series on the new graphics system in R2014b.
- Part 1: Features of the New Graphics System
- Part 2: Using Graphics Objects
- Part 3: Compatibility Considerations in the New Graphics System
Here is Part 3 of the series.
Contents
- What have we learned so far?
- Section 1: Compatibility Considerations for R2014b graphics
- Why did we make these changes?
- How do the changes affect me?
- How do I find out more about the changes in R2014b graphics?
- Section 2: Visual Differences
- The New Default Colormap
- Line Colors in Plots
- Plot Titles and Labels
- Section 3: Changes that Affect Advanced Graphics Users
- Graphics Functions Return Objects, not Numeric Handles
- Colorbars and Legends are No Longer Axes
- Objects Returned by Certain Charts Have Changed
- UI Controls May Not Appear in a GUI
- What do you do now?
- Have you encountered any incompatibilities?
- Conclusions
What have we learned so far?
In Part 1 of this series, I provided an introduction to the new MATLAB graphics system in R2014b with descriptions of a number of new features. In Part 2, I talked about one of the big changes in R2014b -- graphics functions return MATLAB objects, not numeric handles. In this post, I will talk about compatibility considerations in using R2014b graphics.
This post is longer than my two previous posts. In the first section, I'll talk about the kind of changes we've made in R2014b graphics, why we made those changes, how they affect you, and where to go for more information. The second section describes visual changes in the new graphics system including a new colormap, new line colors in plots, and new sizes for plot titles and axis labels, and these affect everyone. The last section is about changes we've made that affect advanced graphics users and user interface builders. Most of you can skip the more advanced material in the last section.
Section 1: Compatibility Considerations for R2014b graphics
When we talk about compatibility considerations we are talking about changes in R2014b that may not be compatible with code written before R2014b. These incompatibilities can affect your code in one of three ways.
- A visual change that affects how a plot looks
- A change that affects the behavior of your code
- A change that causes an error that will require you to modify your code
Why did we make these changes?
First of all, let me say that here at MathWorks we take compatibility very seriously. We have a rigorous process for vetting potential changes in MATLAB that may affect existing MATLAB code. We evaluate them very thoroughly to determine the extent of their impact. We document those changes in our release notes and provide alternatives whenever possible. Those changes are necessary to allow us to continue to develop MATLAB.
One of our goals for the new graphics system was to introduce a new architecture that would allow us to build new graphics capabilities for the future. We couldn't continue with the old graphics architecture because it was too limiting. The new architecture has also allowed us to fix a large number of outstanding graphics bugs that have accumulated over the years.
Our second goal was to support existing graphics functionality and to minimize the disruption to MATLAB users. We did that by evaluating every change that would introduce an incompatibility in the graphics system. We tested those changes in house with over 100,000 MATLAB files and in person with a large number of advanced graphics users to determine the following:
- How often will a particular incompatibility affect user code?
- Which users will be impacted?
- How hard will it be to identify the effect of a specific incompatibility?
- How much work will be required if code changes have to be made?
The results of all this testing allowed us to do two things. First, it allowed to make changes in the new graphics system before the release to minimize the effect of certain incompatibilities. Second, it told us what kind of documentation and tools would be required to help people make the transition.
How do the changes affect me?
Anyone using graphics will notice a visual difference in R2014b. People who've seen R2014b tell us the new visual appearance is a big improvement over previous versions of MATLAB. Differences include changes to colormaps, line colors, font sizes, grids, and other visual properties. For most people that's it. That's all you need to know.
Those of you who do advanced graphics programming and build user interfaces may be affected by incompatibilities that will require changes to your code. I'll talk about the most common ones in the last section of this post. We've also provided plenty of documentation and some tools to help you make the transition.
How do I find out more about the changes in R2014b graphics?
In preparation for the release of the new graphics system, we created a lot of material to help people understand the changes and make any modifications to their code. Here is a list of resources for information on R2014b graphics:
- MATLAB Graphics in R2014b: Learn about the new graphics system with links to information about new features, compatibility, help and support, and R2014b graphics examples.
- MATLAB Release Notes: Read detailed information about changes in the Graphics and GUI Building sections.
- Graphics Changes in R2014b: Read about changes to R2014b graphics and how to troubleshoot your code.
- Tools for transitioning to R2014b Graphics: Download tools to check for incompatibilities and find missing graphics in GUIs.
- Graphics Performance: Find techniques to maximize graphics performance.
- System Requirements for Graphics: Troubleshoot issues associated with graphics cards and drivers.
- MATLAB Answers: Find answers to common questions about using R2014b graphics.
Section 2: Visual Differences
Anyone who uses MATLAB graphics in R2014b will see that plots look quite different. In this section, I will show you some of the big visual differences. As we go through these examples, I think you'll agree that the changes in R2014b are a big improvement over previous MATLAB versions. Of course, there may be times when you may want to change some of these visual properties. I will either tell you how to do that or I will provide a link to the documentation for more information.
The New Default Colormap
In MATLAB, the colormap is a matrix of RGB color values used to set the colors for images and surfaces. For example, when you call the surf function you get a plot where the surface color is proportional to the height of the plot. Colors are based on the values from the colormap.
In R2014b, we introduced a new colormap called parula which is now the default. In previous versions of MATLAB, the default colormap was jet. Here's a comparison of the colormaps between R2014a and R2014b.
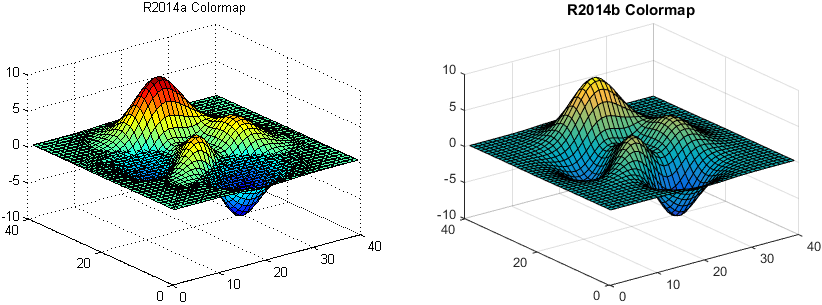
We changed the default colormap to address problems with rainbow colormaps like jet. The new parula colormap is ordered from dark to light and is perceptually uniform. For more information about the issues with rainbow colormaps like jet, see the post on Steve Eddins blog called A New Colormap for MATLAB – Part 2 – Troubles with Rainbows. You can use the colormap function to change the colormap to whatever you want it to be. For example, to change the colormap to jet use the following command after you create your plot.
colormap(jet)
Line Colors in Plots
We've also changed the lines colors used for plots. These line colors were selected to make lines easier to distinguish and to help people with certain types of color blindness.
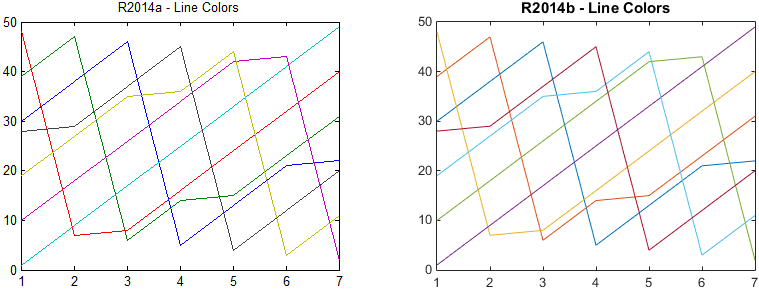
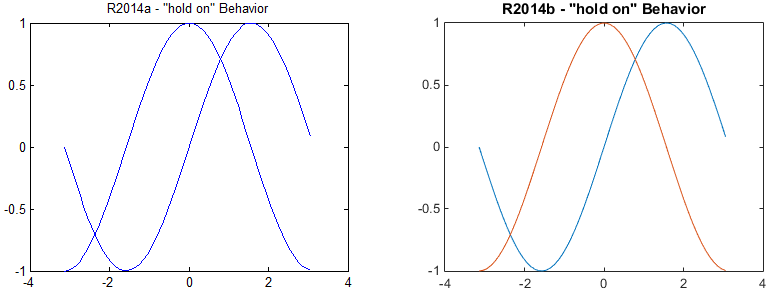
The line colors used in plots are controlled by the ColorOrder property of the Axes object. One other note regarding line colors in plots. In R2014b, when plot is called with hold on, MATLAB will use the next color in the color order for each call to plot. That gives plots with different line colors. In previous versions, each call to plot would start over in the color order so that each line would be the same color.
For information on controlling the colors in the ColorOrder see the documentation section Why Are Plot Lines Different Colors?
Plot Titles and Labels
One last change regarding appearance of plots. In R2014b, plot titles and axis labels use a larger font size than in previous versions of MATLAB and plot titles are bold by default.
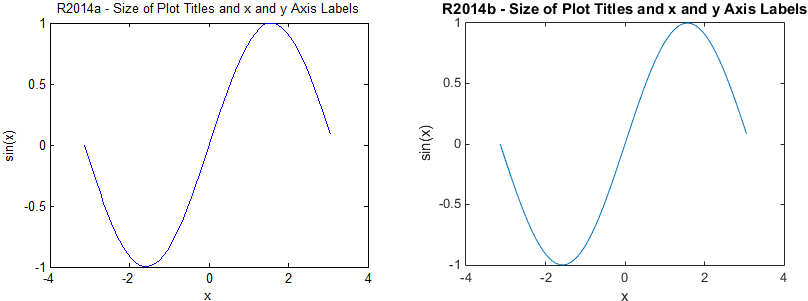
I intentionally used a very long title in this plot to make a point. In this case, the title is so long it extends beyond the boundaries of the axes. You can control your plot title and axis labels using the TitleFontWeight, TitleFontSizeMultiplier, and LabelFontSizeMultiplier properties. For more information see How Do I Make the Graph Title Smaller?
That covers the major visual changes for plots in R2014b. The next section covers changes that only affect advanced graphics users and GUI builders.
Most of you can stop reading here and get on with the rest of your day.
Section 3: Changes that Affect Advanced Graphics Users
If you are still reading, I assume you do some advanced graphics programming in MATLAB or maybe you build MATLAB user interfaces. In this section I'm going to cover the four most common non-visual changes in R2014b graphics that you are likely to encounter. If you do encounter one of these, you will probably have to make changes to your code.
Graphics Functions Return Objects, not Numeric Handles
I mentioned this briefly in Part 2 of this series. Graphics functions now return objects, not numeric handles. The R2014b documentation has detailed information about this subject in the section called Graphics Handles Are Now Objects, Not Doubles. I will give a couple of simple examples to illustrate what can happen with code written before R2014b.
Prior to R2014b, you could store a set of handles to graphics objects in an array and then add some numeric data to that array. In R2014b, that will cause an error.
x = -pi:0.1:pi ;
y1 = sin(x);
y2 = cos(x);
myLines = plot(x,y1,x,y2)    % plot returns an array of two Line objects
If you then try to set myLines(3) = 1.2, you get the following error.
Cannot convert double value 1.2 to a handle
MATLAB won't let you add numeric values to an array of graphics objects. A similar problem occurs if you try to use an object handle in a function where MATLAB expects a numeric value. A simple example of this happens with the sprintf function.
a = sprintf('You clicked on figure %d\n', gcf);
The %d specification in the sprintf format string expects an integer value. However, since gcf is a figure object, you get the following error.
  Error using sprintf
  Function is not defined for 'matlab.ui.Figure' inputs.
Here is one final example. Because graphics handles used to be numbers, you could use them in logical expressions.
if (get(0, 'CurrentFigure'))
  disp(['Figure ' get(gcf, 'Name')'])    % display the figure name for gcf
else
  disp('No open figures')                % there is no open figure
end
This worked in earlier versions of MATLAB because get(0,'CurrentFigure') would return either an empty array or a numeric figure handle. Both of these values are valid in the logical test of the if statement above. In R2014b, this will cause an error.
Conversion to logical from matlab.ui.Figure is not possible.
We have tried to maintain compatibility with previous releases in some cases. For example, you can still use 0 to refer to the graphics root in functions like get and set. As a best practice, however, we now recommend using the groot function to get the graphics root. Similarly, we still support the use of literal integer values to refer to figures in functions like set, get, and figure. Again, the best practice is to use a variable which contains the object when using these functions.
If you find yourself really stuck, it is possible to cast object handles to numeric handles using the double function. You can then cast the number back to an object handle using the handle function. We don't recommend this as a long term solution. Be aware that we may choose to remove this feature in a future version of MATLAB. If we do, we'll let you know in advance.
Colorbars and Legends are No Longer Axes
In earlier versions of MATLAB, the legend and colorbar functions created objects whose type was 'axes'. Technically, legends and colorbars were subclasses of axes. In R2014b, the legend function creates a Legend object and the colorbar function creates a ColorBar object.
So what does that mean? First, the results of a findobj call in R2014b may be different than in previous versions. In R2014b, the command
findobj('Type', 'Axes')
will not return any legend or colorbar objects. To get those objects you will need to do the following:
findobj('Type', 'Legend')
findobj('Type', 'ColorBar')
Second, legends and colorbars cannot become the current axes. Prior to R2014b, you could write code that looks like this:
plot(1:10)
cb = colorbar;
axes(cb)                % Make the colorbar the current axes
title('My Colorbar')    % set the title of the colorbar
If you try to run this code in R2014b you will see an error.
  Error using axes
  Handles of type ColorBar cannot be made the current axes
In R2014b, you can still use the title function. Just give it the colorbar handle as the first argument.
title(cb, 'My Colorbar')
Alternatively you can use the colorbar's Label property to get the text object for the label and set its string property.
cb.Label.String = 'My Colorbar'
Objects Returned by Certain Charts Have Changed
Charting functions like bar, contour, stem and others return one or more graphics objects. In previous versions of MATLAB, those objects had names like barseries, contourgroup, and stemseries. These objects were each a special type of object called an hggroup. Each of these hggroup objects had a set of children. The children were low level objects like lines or patches. Here is an example from R2014a.
[~,h] = contour(peaks, 'LineLevels', -6:1:8) ;
get(h, 'Type')        % an hggroup object is returned by the contour function
ans =
hggroup
ch = get(h, 'Children') ;
get(ch(1), 'Type')    % the children of the hggroup are patch objects
ans =
patch
Prior to R2014b, the contour command returned an hggroup object that had children that were patch objects (one for each contour line). Using the patch objects, it was then possible to do interesting things with the contour lines. You could, for example, make the even numbered contour lines solid and make the odd numbered contour lines dashed as shown below.
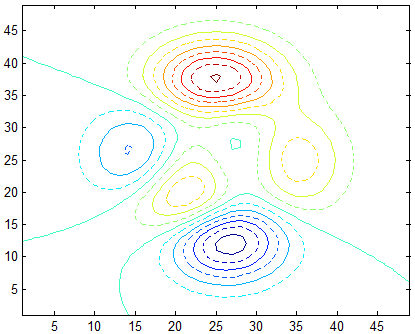
As you've probably guessed, things are different in R2014b. First, the types of the objects returned by these functions are different. For example, the bar function returns a Bar object and the contour function returns a Contour object. Second, the objects returned by these functions no longer have any children. That means you can't get to the low-level objects.
So what do you do? You have to take a different approach. In the code below, I've create two contours -- one with solid lines and one with dashed lines. This code will create a plot like the one shown above. It works in R2014b and in previous versions of MATLAB.
major = -6:2:8;
minor = -5:2:7;
[~,hmajor] = contour(peaks,'LevelList',major);    % contour with even-numbered levels
hold on
[~,hminor] = contour(peaks,'LevelList',minor);    % contour with odd-numbered levels
set(hminor,'LineStyle',':')                       % make the odd-numbered levels dotted
hold off
UI Controls May Not Appear in a GUI
There is one last change that I want to talk about. It can affect MATLAB GUIs created before R2014b. Suppose I have a simple GUI with a panel and a button. I might have code that looks something like this:
figure('NumberTitle', 'off', 'Name', version('-release'), ...
    'Position', [100 100 350 260], 'MenuBar', 'none', 'Toolbar', 'none') ;
button = uicontrol('Style', 'pushbutton', 'String', 'My Button', ...
    'Units', 'normalized', 'Position', [0.4 0.5 0.25 0.15]) ;
panel = uipanel('Position', [0.10 0.10 0.8 0.8], 'Title', 'My UIPanel') ;
Seems OK right? Here's what it looks like in R2014a and R2014b.
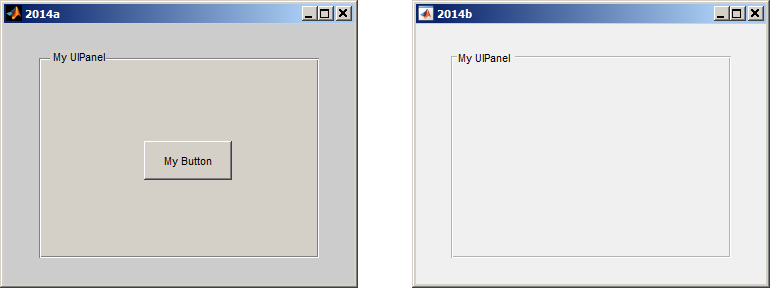
So what happened here? I don't see my button in R2014b. Where did it go? It turns out that the button is still there but in R2014b it is drawn under the panel.
In previous versions of MATLAB, uicontrols were always drawn on top on uipanels regardless of the order in which they were created. In R2014b, the two components are drawn in creation order. Since the panel was created after the button, it is drawn on top. What I really want is to have the button be a child of the panel. In order to do that, I can change my code to look like this:
figure('NumberTitle', 'off', 'Name', version('-release'), ...
    'Position', [100 100 350 260], 'MenuBar', 'none', 'Toolbar', 'none') ;
panel = uipanel('Position', [0.10 0.10 0.8 0.8], 'Title', 'My UIPanel') ;
button = uicontrol('Parent', panel, 'Style', 'pushbutton', 'String', 'My Button', ...
    'Units', 'normalized', 'Position', [0.4 0.5 0.25 0.15]) ;
You can also fix this problem in GUIDE by moving the button out of the panel and then moving it back in. This will automatically make the button a child of the panel.
You can check your existing GUIs by downloading a tool from Tools for transitioning to R2014b Graphics. For more information, see Why Are Some Components Missing or Partially Obscured?
What do you do now?
Read the materials I've listed above to learn more about the changes to graphics in R2014b and how they might affect your MATLAB code. Download the tools and run them on your code and your GUIs. If you aren't able to find the information you need to work around one of the changes in R2014b, contact our Technical Support Team . They are very familiar with the changes in R2014b and can help you find a solution.
Have you encountered any incompatibilities?
Have you encountered any of these changes in R2014b? Have you been able to find the information you need? Have you been able to use this information to make necessary changes to your code? Have you tried the transition tools? We'd love to hear your thoughts here.
Conclusions
I am hopeful that this series of posts has given you a good introduction to the R2014b graphics system. There's a lot of new stuff to digest in this release. Try these things out and let me know what you think.
Thanks to Loren for letting me take over her space for the last few weeks.
- カテゴリ:
- Graphics,
- New Feature




コメント
コメントを残すには、ここ をクリックして MathWorks アカウントにサインインするか新しい MathWorks アカウントを作成します。