MATLAB R2014b Graphics – Part 1: Features of the New Graphics System
Today I’d like to introduce a guest blogger, David Garrison, who is a MATLAB Product Manager here at MathWorks. This is the first in a series of blogs over the next few weeks describing the new graphics system in R2014b and how some of the changes will affect you.
- Part 1: Features of the New Graphics System
- Part 2: Using Graphics Objects
- Part 3: Compatibility Considerations in the New Graphics System
Here is Part 1 of the series.
Contents
- Big Changes in R2014b
- The New MATLAB Graphics System
- The New Look of MATLAB Graphics
- Rotatable Tick Labels
- Automated Updating of datetime Tick Labels
- Animated Plots
- Multilingual Text and Symbols in Plots
- User Interfaces with Tab Panels
- Improved Histograms
- Have you tried the new graphics system in R2014b?
- Next up -- Part 2: Using Graphics Objects
Big Changes in R2014b
There are a number of big changes in R2014b. Some of the new features include:
- New MATLAB graphics system
- Date and time data types with time zone and display options
- Git and Subversion source control integration and access to projects on GitHub from File Exchange
- MATLAB toolbox packaging as single, installable files for easy sharing and downloading of user-developed tools
- MATLAB MapReduce™ data analysis that scales Hadoop for big data
- Arduino and Android hardware support for interacting with motors and actuators, and for accessing sensor data
You can learn more about all these features in the MATLAB R2014b Release Notes. This post is all about the new graphics system.
The New MATLAB Graphics System
R2014b includes a new MATLAB graphics system. The new graphics system includes many new features which we will describe in this blog post. In Part 2 of this series, we will describe how graphics handles have changed in R2014b and how to use graphics objects. Finally, there are some changes in the new system which may require changes in some existing graphics related code. We'll discuss compatibility considerations in Part 3 of this series.
The New Look of MATLAB Graphics
When you create a plot in R2014b, you'll see that MATLAB graphics look different than previous versions.
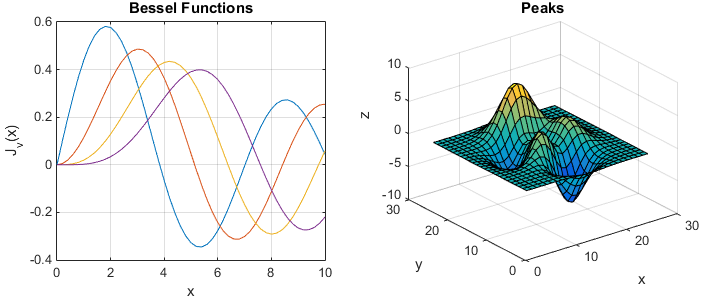
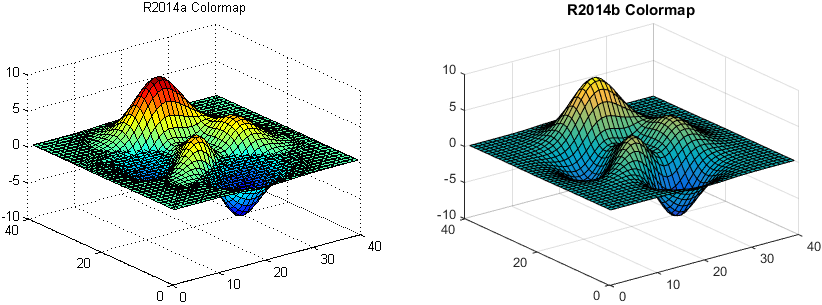
The first thing that you will notice is that lines are plotted using a different set of colors. New line colors were selected to make it easier to distinguish lines from one another and to help people with certain types of color blindness. There is also a new default colormap in R2014b called parula. The colors in the parula colormap are ordered from dark to light and are perceptually uniform. Smooth changes in the data appear as smooth changes in color, while sharp changes in the data appear as sharp changes in color. Grid lines are now gray to make data stand out visually. Axis labels and titles are larger and more prominent. Lines and text are now anti-aliased (smoothed) to remove jagged edges.
Rotatable Tick Labels
If you're like me, you sometimes need to use long labels for the ticks in your plot. In previous versions of MATLAB, tick labels were always displayed horizontally as shown on the left in the example below. In the new graphics system, ticks can be rotated so you can create a plot like that shown on the right. Tick labels on both the x and y axes can be rotated.
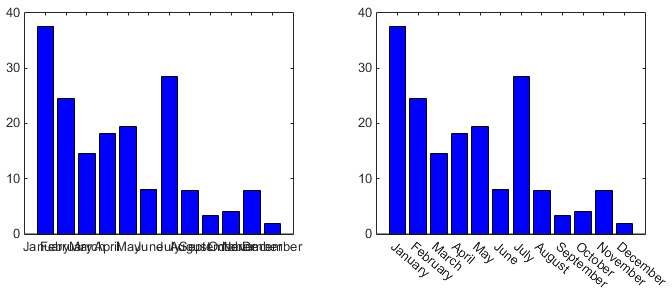
For example, to rotate the X tick labels, use the XTickLabelRotation property of the Axes object:
ax = gca;
ax.XTickLabelRotation = -40;
Automated Updating of datetime Tick Labels
R2014b includes a new date and time data type called a datetime array. When you create a plot with a datetime array, the tick labels will automatically update as you pan or zoom in the plot. Tick labels change from days to hours to minutes to seconds as shown below.

Animated Plots
MATLAB R2014b graphics introduces a new function called animatedline. The code below shows how to create an animatedline and add points to it.
x = 1:100;
y = rand(1,100);
myLine = animatedline;
myLine.Color = blue;
xlim([1 100])
ylim([0 1])
for i = 1:100
  addpoints(myLine,x(i),y(i))
  pause(0.1)
end
The result is a plot that changes over time. The picture below shows how the plot looks at iterations 20, 50, and 80 as points are added.

Multilingual Text and Symbols in Plots
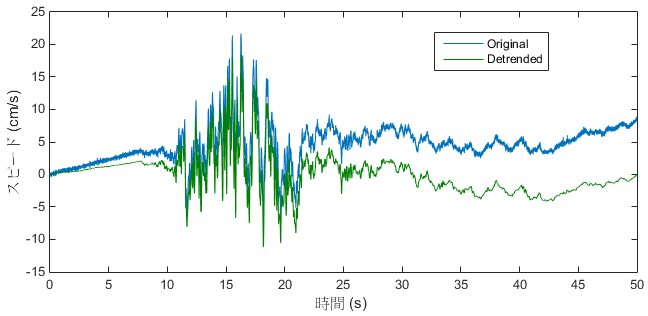
R2014b graphics also supports the use of Unicode characters to show multilingual text in axis labels and titles and in user interface controls. Here is an example. See the native2unicode function for more information about Unicode strings.
User Interfaces with Tab Panels
Creating a user interface with tab panels has been a common request among MATLAB UI builders. In the past, people had done it using undocumented functions. In R2014b, those functions have been updated and are now fully documented and supported.
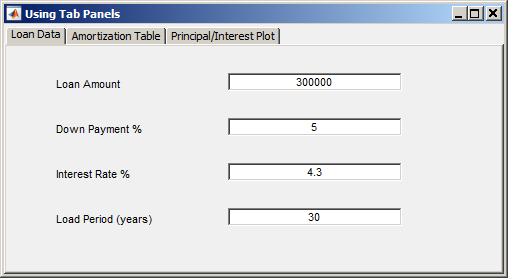
You can easily create a user interface like the one shown above using the new uitabgroup and uitab functions.
myFig = figure('Toolbar', 'none', ...                     % Create the figure
    'Menubar', 'none', 'Name', 'Using Tab Panels');
tgroup = uitabgroup('Parent', myFig);                     % Create the tabgroup
tab1 = uitab('Parent', tgroup, 'Title', 'Loan Data');     % Create the tabs
tab2 = uitab('Parent', tgroup, 'Title', 'Amortization Table');
tab3 = uitab('Parent', tgroup, 'Title', 'Principal/Interest Plot');
Improved Histograms
The new histogram function plots histograms with data-dependent bin picking. It provides capabilities that the traditional hist function does not including options for bin control, normalization, and visualization.

The code below shows how to create two overlapping histograms and modify their properties after they are created.
data1 = randn(5000,1);
data2 = randn(5000,1)+ 2;
h1 = histogram(data1);
hold on
h2 = histogram(data2);
hold off
legend show
h1.BinMethod = 'sturges';
h2.Normalization = 'countdensity';
Have you tried the new graphics system in R2014b?
Have you installed MATLAB R2014b? Have you tried the new graphics system? We'd love to hear your thoughts here.
Next up -- Part 2: Using Graphics Objects
Well, that's all for now. Be sure to check out Mike Garrity's new blog, Mike on MATLAB Graphics, for some cool ideas about what you can do with the new graphics system.
In my next post I'll talk about how graphics handles have changed in R2014b and how to use graphics objects.
 Cleve’s Corner: Cleve Moler on Mathematics and Computing
 The MATLAB Blog
 Guy on Simulink
 MATLAB Community
 Artificial Intelligence
 Developer Zone
 Stuart’s MATLAB Videos
 Behind the Headlines
 File Exchange Pick of the Week
 Hans on IoT
 Student Lounge
 MATLAB ユーザーコミュニティー
 Startups, Accelerators, & Entrepreneurs
 Autonomous Systems
 Quantitative Finance
 MATLAB Graphics and App Building




Comments
To leave a comment, please click here to sign in to your MathWorks Account or create a new one.