
Explore your IoT data with ThingSpeak and MATLAB
Today I'd like to introduce you to a guest blogger, Eric Wetjen, who is a Product Marketing Manager here at MathWorks. Today, Eric will be discussing ThingSpeak, a platform for collecting and analyzing Internet of Things (IoT) data with MATLAB.
Contents
- Introduction
- Offline Analysis: Analyzing Data stored on ThingSpeak
- Reading One Week of Traffic Data into MATLAB
- Plotting Raw Traffic Data
- Looking at Daily Sums for Eastbound Traffic as a histogram
- Taking a Deeper Look at an Individual Day
- Downsampling into 48 Bins of 30 Minute Chunks of Data and Finding Peaks
- Online Analysis: Calculating and Scheduling MATLAB Code inside ThingSpeak
- Viewing the Calculated Data Online
Introduction
Did you know you can collect and analyze data from internet-connected sensors using ThingSpeak? ThingSpeak is a web service for prototyping IoT applications. ThingSpeak allows you to collect, analyze and act on your data and includes a MATLAB Analysis App in the cloud for analyzing data you have sent to ThingSpeak. We'll show how you can analyze your ThingSpeak data in desktop MATLAB, and we'll also show how can run your MATLAB analysis code in the cloud using the MATLAB Analysis App built-into by ThingSpeak.
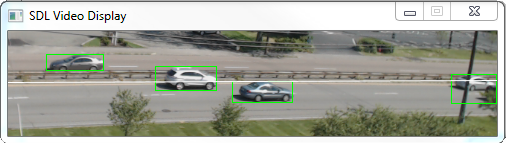
In this project, we used a Raspberry Pi, a web cam and ThingSpeak to count cars and analyze traffic patterns on a busy highway. Our car counter sends data to channel 38629 on ThingSpeak every 15 seconds.
The counting of the cars from the web cam images is done on a Raspberry Pi 2 and only the number of cars seen every 15 seconds is sent by the device to ThingSpeak. The hardware setup and the development of the car counting algorithm is described completely in the following File Exchange submission. A picture of the sensor setup and a view of how the raw data is displayed in ThingSpeak are shown below.
Once the data is collected in ThingSpeak, we are ready to use MATLAB to look at the traffic patterns. Today, we will focus on the data analysis and visualization of the traffic data using MATLAB and ThingSpeak.


Offline Analysis: Analyzing Data stored on ThingSpeak
In order to gain some insight into our traffic data, we first need to import the data from ThingSpeak into desktop MATLAB. To simplify the retrieval of the data from ThingSpeak, we use the functions from the ThingSpeak Support Toolbox, available on MATLAB Central File Exchange.
Reading One Week of Traffic Data into MATLAB
We begin by specifying a start date and an end date using a datetime object. Because we are sending data to ThingSpeak once every 15 seconds, we have approximately 40,000 data points to retrieve. ThingSpeak allows only 8000 points in a single read operation, so we create a for loop to gather the data in batches. We then append the traffic and time data from each iteration into two vectors, called alltrafficData and timestamp.
endDate = datetime('3/13/2016', 'InputFormat', 'MM/dd/yyyy');
startDate = datetime('3/6/2016', 'InputFormat', 'MM/dd/yyyy');
% Create date vector
dateVector = startDate: endDate;
% check to see that the last dateVector value is the same as endDate, if
% not append it
if (dateVector(end) ~= endDate)
   dateVector = [dateVector, endDate];
end
alltrafficData = [];
timestamp = [];
% Read data in chunks because ThingSpeak has a limit of 8000 pts per read
for dayCount = 1:length(dateVector)-1
   dateRange = [dateVector(dayCount), dateVector(dayCount+1)];
   [channelData, t] = thingSpeakRead(38629, 'DateRange', dateRange);
   [alltrafficData] = [alltrafficData; channelData ];
   [timestamp] = [timestamp; t];
end
Plotting Raw Traffic Data
Next we plot the data and label the graph. The daily fluctuations in traffic are clearly visible from the raw data. Immediately, we can see the peaks corresponding to the morning and afternoon "rush hours".
figure
plot(timestamp, alltrafficData)
datetick
xlabel('Date')
ylabel('Vehicle Count per 15 second interval')
grid on
title('Traffic Volume for the week of March 6')
legend('West Bound Traffic','East Bound Traffic')

Looking at Daily Sums for Eastbound Traffic as a histogram
To visualize the volume of traffic each day, we sum up the raw traffic data and use a bar chart to visualize it. It looks like our busy highway sees from 45,000 to 65,000 cars per day!
eastTraffic = alltrafficData(:,2);
westTraffic = alltrafficData(:,1);
for i=1:4  % remove a few pts to be evenly divisible by 5647 (points in a day)
eastTraffic(i) = [];
westTraffic(i) = [];
end
% Divide data into 7 chunks (approximates a 24 hour day)
dailysumeast = sum(reshape(eastTraffic, floor(length(alltrafficData)/7),[]));
dates = dateVector; % convert to serial date for bar plot
dates(8) = [];
dates = datenum(dates);
figure
bar(dates,dailysumeast)
grid on
xlabel('Date')
ylabel('Vehicle Count per day')
ax = gca;
ax.YAxis.Exponent = 3;
title('East Bound Traffic Volume for the week of March 6')
datetick

Taking a Deeper Look at an Individual Day
To gain more insight into our traffic data, we look at traffic on an individual day. For each day, we specify a start time and a stop time.
clear all
startTime{1} = 'March 8, 2016 00:00:00';
stopTime{1} = 'March 8, 2016 23:59:59';
% We retrieve the data from ThingSpeak, and we
% downsample the data to remove short-term fluctuations.  We then use the
% findpeaks function to plot and find the times where the traffic volume is
% highest. For simplicity, we look at the eastbound data only.
startDate = datetime(startTime{1}, 'InputFormat', 'MMMM d, yyyy HH:mm:ss ');
endDate = datetime(stopTime{1}, 'InputFormat', 'MMMM d, yyyy HH:mm:ss ');
datevector = [startDate, endDate];
[Daily, t] = thingSpeakRead(38629, 'DateRange', datevector);
% Look at east bound traffic only
DailyEast = Daily(:, 2);
timestamp = datetime(t,'ConvertFrom','datenum');
dateAnalyzed = startTime{1};
dateAnalyzed = {dateAnalyzed(1:(end-8))};
Downsampling into 48 Bins of 30 Minute Chunks of Data and Finding Peaks
The raw traffic data is very spiky and hard to visualize. If we want to see what time of day has the highest volume of traffic, we need to look at the data on a time scale larger than 15 seconds. To do this we divide the 24 hour day into 30 minute segments. Each segment begins at the top of the hour and ends 30 minutes later.
downsamplesize = floor(length(DailyEast)/48);
teastper30=datetime(startTime{1});
DailyEastper30(1:48) = 0; % pre-allocate
for k = 1:48  % calucate daily tarffic in each 30 minute segment
DailyEastper30(k) = sum(DailyEast(1+downsamplesize*(k-1):downsamplesize*k));
teastper30(k+1) = teastper30(k)+1/48; % timestamps showing end of each 30 minute period
end
teastper30=teastper30';
teastper30(1) = []; % start first bin at 12:30 am
timestampPer30 = teastper30;
% Find peaks and their times (locations)
[peaks,location] = findpeaks(DailyEastper30,  'Threshold',100, 'MinPeakHeight', 1100);
% Plot peaks
figure
findpeaks(DailyEastper30, datenum(timestampPer30),'Threshold',100, 'MinPeakHeight', 1100)
datetick
xlabel('Time of Day')
ylabel('Vehicle count per 30 minutes')
title(strcat('Peak volume on ', {' '}, dateAnalyzed))
dateAnalyzed
peaktimes = timestampPer30(location)
DailyVolume = sum(DailyEast)
dateAnalyzed =
    'March 8, 2016 '
peaktimes =
   08-Mar-2016 06:00:00
   08-Mar-2016 07:30:00
   08-Mar-2016 12:30:00
   08-Mar-2016 14:00:00
   08-Mar-2016 15:30:00
   08-Mar-2016 17:30:00
   08-Mar-2016 20:00:00
DailyVolume =
       51175

Online Analysis: Calculating and Scheduling MATLAB Code inside ThingSpeak
So far we have brought the data from ThingSpeak back into MATLAB to do some offline analysis of weekly and daily traffic patterns. But what if we want to compute the daily volume of traffic and send that data to another channel on ThingSpeak? It’s very simple to do the calculation offline, but ThingSpeak with its MATLAB integration enables us to do this online too. To calculate the daily volume of traffic, we use the MATLAB Analysis App available on Thingspeak.com. We write code to fetch the previous day’s raw traffic data and we sum up the results. We then use the thingSpeakWrite command to send the data to a new channel called Daily Volume.

Finally, we schedule our analysis to run once a day just after midnight using the ThingSpeak TimeControl App.

Viewing the Calculated Data Online
We have now created a channel that reports the daily volume of cars counted. Because this channel is on ThingSpeak and the MATLAB Analysis App is built in, we can look at this analysis at any time using any web browser on a PC or mobile device. To see the calculated value, go to channel 51671 on ThingSpeak.
Because ThingSpeak is a cloud service, it will execute the MATLAB analysis code to calculate this value every day even when you are not logged into ThingSpeak.
For more information on how to send data to ThingSpeak, see this support page. If you have a MathWorks account, you already have access to ThingSpeak. Just log-in and explore at ThingSpeak.com!
What kind of IoT data are you trying to access? As you prototype your IoT system, how are you doing your online and offline analysis? We'd like to hear here!


评论
要发表评论,请点击 此处 登录到您的 MathWorks 帐户或创建一个新帐户。